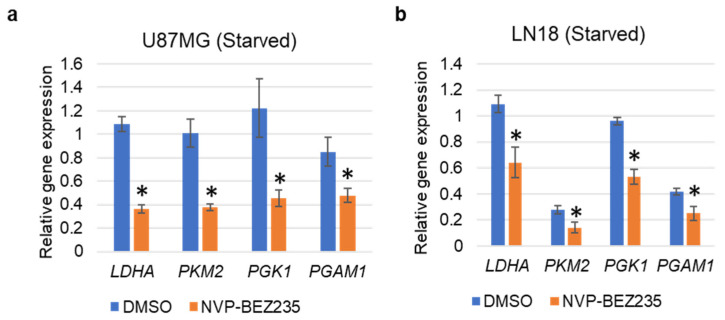
Figure 4.
qRT-PCR validation of the glycolysis-related genes under serum starvation in (a) U87MG, and (b) LN18 cell lines grown in serum-free medium. The relative expression of the genes (compared to ACTB, encoding actin) was analyzed in control DMSO and NVP-BEZ235 samples (five days 1 μM NVP-BEZ235 with no FBS). The error bars represent the standard deviation of the genes (n = 4). Asterisks (*) represent the significantly expressed genes (p < 0.05) as compared to control (DMSO). Significance was determined by Student’s t-Test.

