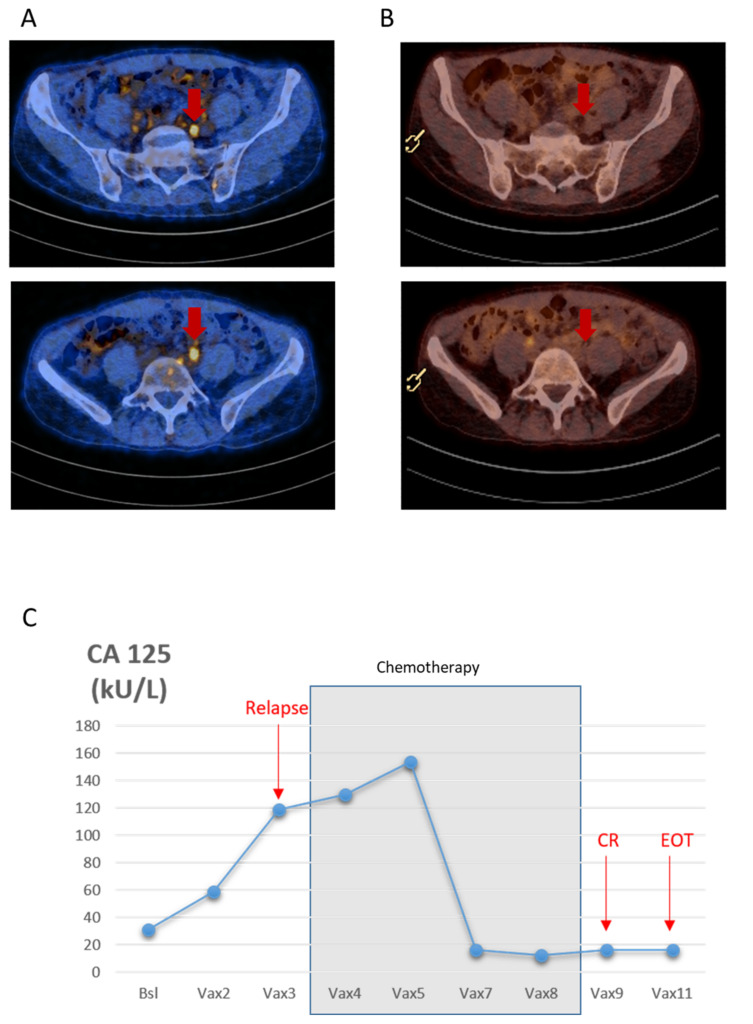
Figure 2.
(A) PET-CT images showing three lymph nodes with pathological tracer uptake with a small diameter (11 mm, 9 mm and 6 mm). (B) PET-CT images showing complete radiological response. (C) Longitudinal representation of CA-125 values from baseline (November 2019) to relapse (February 2020) and complete response (CR) (July 2020) until end of treatment (EOT) (October 2020) The chemotherapy treatment period is indicated in grey.

