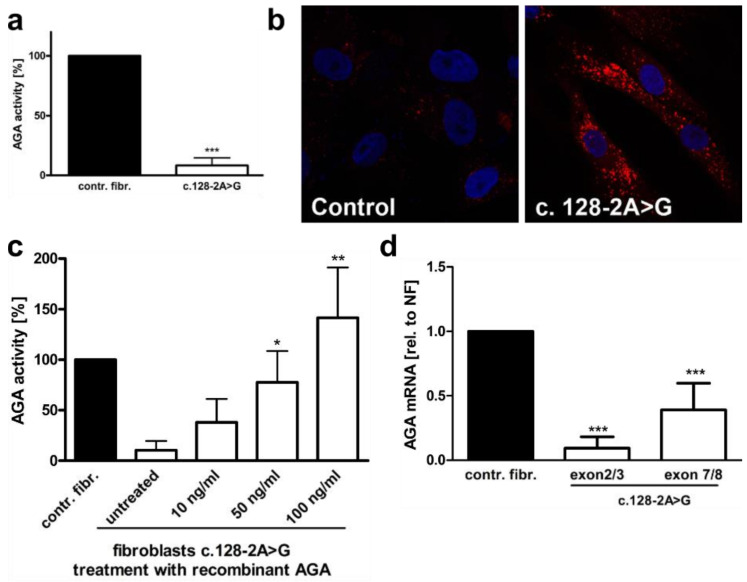
Figure 2.
Characterization of the c.128-2A>G AGU variant. (a) Control and c.128-2>G AGU fibroblasts were lysed, and the AGA activity was measured fluorometrically. Eleven independent experiments were performed. The graph shows the mean of the data ± SD. Statistical analysis was performed with unpaired t test. (b) Control fibroblast and the fibroblasts of the patient were stained with Lysotracker-red to visualize lysosomal abnormalities. (c) The patient fibroblasts were treated with the indicated amounts of recombinantly expressed, Strep-tagged AGA fusion protein for 48 h, and the AGA enzyme activity was measured and compared with the control fibroblasts whose activity was set to 100%. (d) Quantitative real-time PCR of AGA mRNA in patient fibroblasts with the c.128-2A>G variant. AGA transcript was detected with two different primer pairs, one for exons 2 and 3 and the other one for exons 7 and 8. The c.128-2A>G variant leads to skipping of exon 2, as indicated by the lower transcript amount with the exons 2+3 primers as compared to the primer pair for exons 7+8. Bars represent the mean ± SD of 10 independent experiments. Statistical analysis was done by one-way ANOVA against the control fibroblasts. Values of p < 0.05 were considered significant (*) while values of p < 0.01 were considered very significant (**) and p < 0.001 extremely significant (***).

