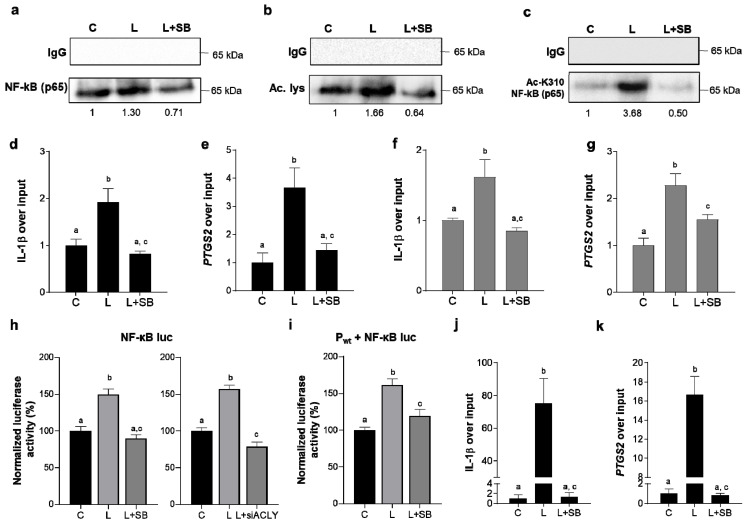
Figure 3.
Nuclear ACLY fostered NF-κB acetylation and its activity. Human PBMC-derived macrophages were triggered by LPS in the presence or absence of SB and (a) immunoprecipitated with an antibody directed to acetylated lysine and analyzed by western blot with an anti-NF-κB (p65) antibody. (b) In macrophages triggered by LPS, with or without SB, NF-κB (p65) was immunoprecipitated with a specific antibody, and then an antibody against acetylated lysine was used in western blot experiments. (c) Macrophages treated and immunoprecipitated as in (b) were analyzed by western blot with an anti-NF-κB p65 (acetyl K310) antibody. In (a–c), IgG is the negative control. (d,e) Human PBMC-derived macrophages, treated as in (a), were used to carry out chromatin immunoprecipitation (ChIP) analysis with an antibody against subunit p65 of NF-κB, and then specific primers were used in the real-time PCR experiments to analyze the IL-1β and PTGS2 gene promoters. (f,g) Human PBMC-derived macrophages, treated as reported above, were used to carry out ReChIP experiments with a first antibody against subunit p50 of NF-κB and then with an anti-NF-κB p65 (acetyl K310) antibody. Specific primers were used in the real-time PCR experiments to analyze the IL-1β and COX2 gene promoters. (h) Luciferase activity was quantified in iBMDM cells transiently transfected with NF-κB luc in the presence or absence of SB (left panel) or with siRNA targeting human ACLY (siACLY) or control scramble siRNA (right panel) and triggered by LPS. (i) iBMDM cells transfected with NF-κB luc plus an ACLY overexpression vector (Pwt) and triggered by LPS in the presence or absence of SB were used for luciferase luminescence detection. (j,k) Human PBMC-derived macrophages treated with LPS for 3 h in the presence or lack of SB-204990 (SB) were used to carry out chromatin immunoprecipitation (ChIP) analysis with an antibody against acetylated histone H3, and then specific primers were used in the real-time PCR experiments to analyze the IL-1β and PTGS2 gene promoters. In (d–k), data are representative of 3 independent experiments and are presented as means ± SD (error bars). Different letters above the bars indicate significant differences between treatments at p < 0.05, according to Tukey’s post hoc test performed after one-way ANOVA. Western blotting data presented are representative of at least 3 independent experiments, and the mean of protein levels normalized versus mean of proteins in untreated cells (C) is reported under each image.

