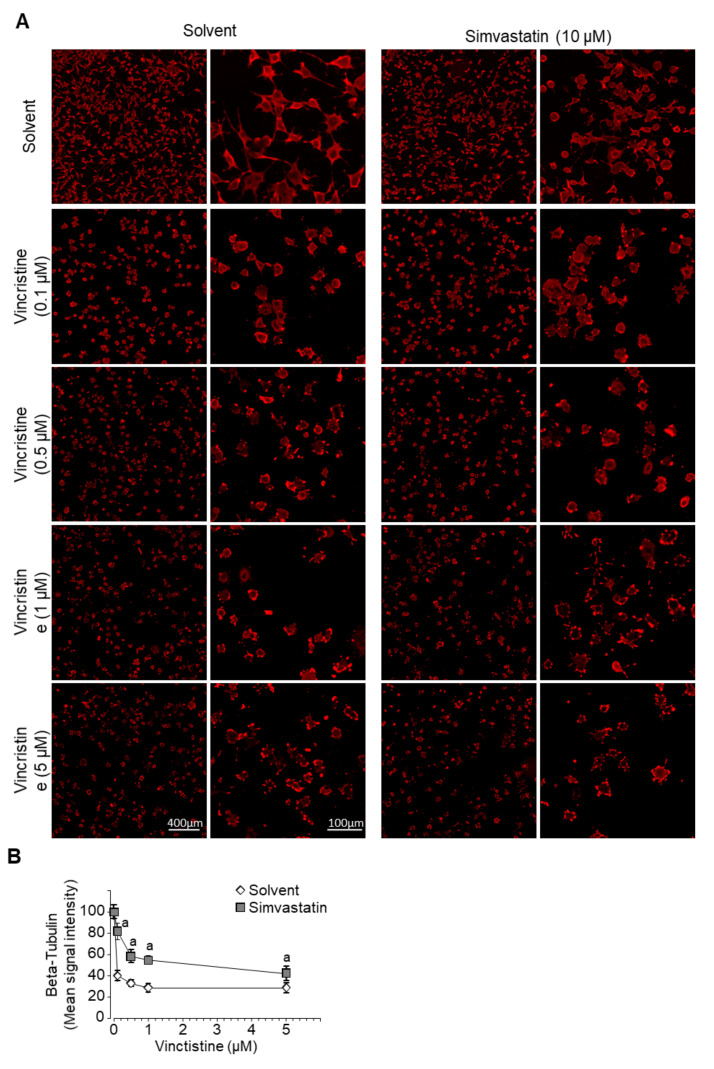
Figure 6.
Simvastatin favors microtubules destabilization by vincristine. (A) Microtubule structure visualized by fluorescent labeling using an anti-β-tubulin antibody. Cells were exposed to increasing concentrations of vincristine for 6 h in the presence or absence of simvastatin (10 µM). (B) Quantification of β-tubulin signal intensity. Results are expressed as mean ± SD (n = 8–10). a: p < 0.05 compared to solvent.

