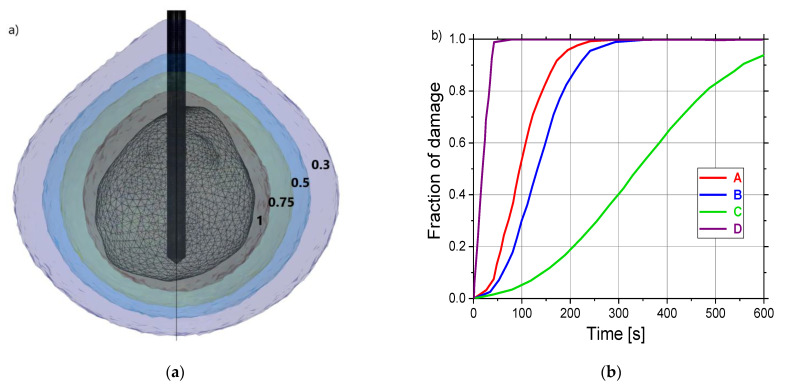
Figure 11.
(a) The liver tumor [70] is shown as triangulated surface and isocontours corresponding to the fractions of damage of 0.3 (violet), 0.5 (blue), 0.75 (dark green), and 1 (dark gray). (b) The time evolution of the necrotic tissue was calculated at four test points (A, B, C, and D) marked in Figure 4b.

