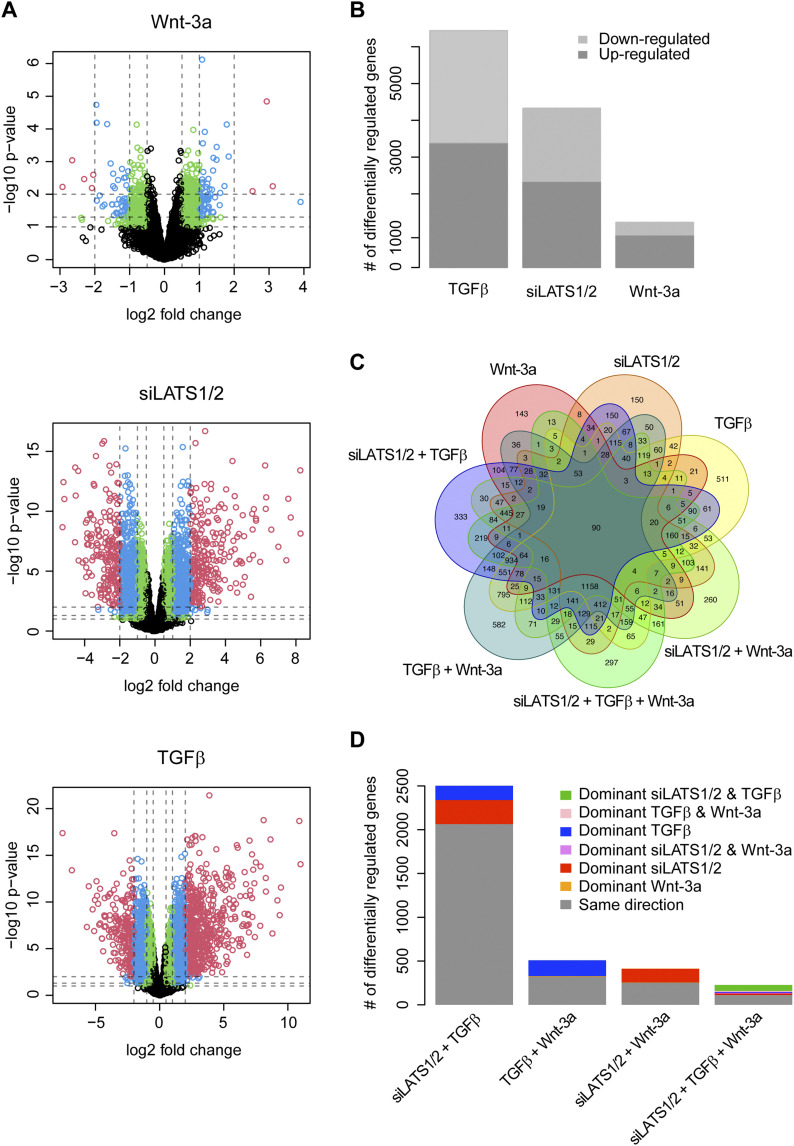
Figure 3. Profound changes in gene expression upon 2 d of treatment with TGFβ, siLATS1/2, and Wnt-3a with a global dominance by TGFβ and siLATS1/2.
(A) Volcano plots for differentially regulated genes of the single treatments (TGFβ, siLATS1/2, and Wnt-3a). The dashed vertical lines show the cutoffs for an absolute fold change of 0.5, 1, and 2. The horizontal lines show the cutoffs for a P-value of 0.1, 0.05, and 0.01. The colors correspond to genes with a fold change of greater than 0.5 and a P-value of less than 0.1 (green), greater than 1 and less than 0.05 (blue), and greater than 2 and less than 0.01 (red). (B) Bar plot showing the numbers of significantly regulated genes by the individual single treatments as well as the directionality of the regulation. (C) Venn diagram of the overlaps between the single and combined treatments. (D) Bar plot showing the numbers of commonly regulated genes between the individual treatments and whether these genes are regulated in the same direction, or if not, which treatments dominate over the others. Data of both cell lines was combined for this and all subsequent computational analysis. For the Venn diagram and bar plots an FDR cutoff of 10% was chosen.

