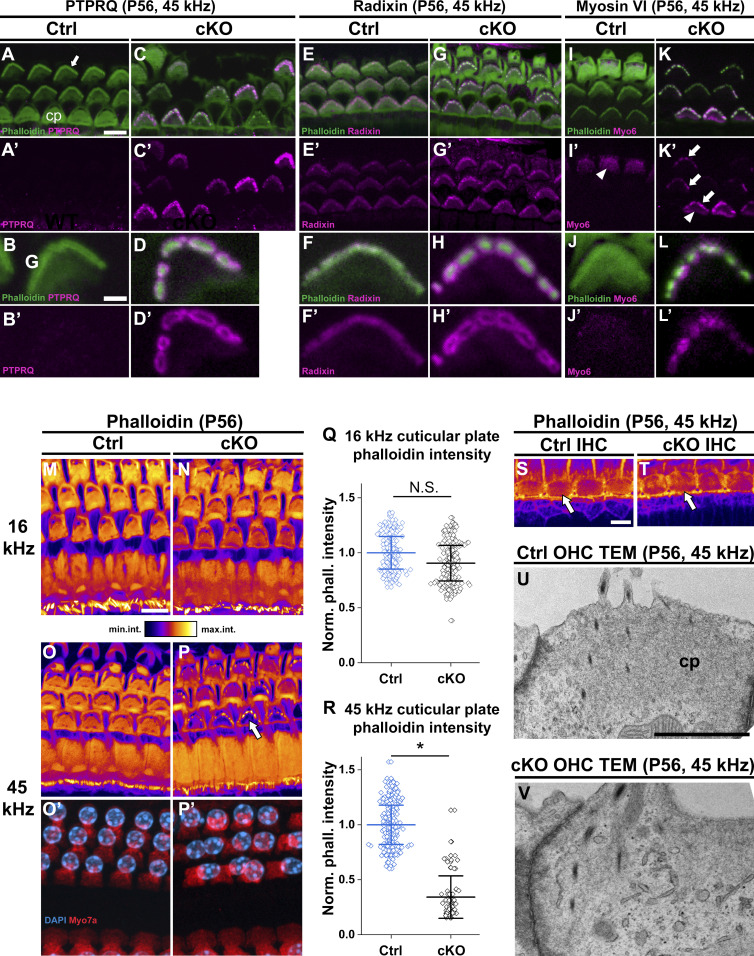
Figure 5. Stereocilia fusion is associated with molecular and morphological changes in the outer hair cells (OHCs) in Manffl/fl;Pax2-Cre B6 mice.
(A, A′, B, B′, C, C′, D, D′) At P56, PTPRQ immunostaining coupled with phalloidin labeling shows that PTPRQ expression is undetectable in the 45-kHz OHCs of control mice, whereas comparable OHCs of cKO mice show PTPRQ up-regulation in the fused stereocilia and the taper region. PTPRQ envelopes the F-actin core of the fused stereocilia. (E, E′, F, F′, G, G′, H, H′) At P56, radixin is weakly expressed in the OHC taper region in control mice, whereas it is mislocalized up to the fused stereocilia in OHCs of mutant mice. Also radixin envelopes the F-actin core of the fused stereocilia. (I, I′, J, J′, K, L, L′) At P56, myosin 6 is expressed in the OHC cuticular plate (arrowheads) and cell body in both genotypes. Similar to PTPRQ and radixin, myosin 6 expression is detected in the fused stereocilia (arrows). The oblique section shows only some OHCs at the stereocilia level, thus leaving out the signal from the cuticular plate but illustrating the stereociliary myosin 6 in the mutant. (M, N, O, O′, P, P′) Phalloidin fluorescence illustrated with an intensity-coded lookup table in the 16 and 45-kHz OHCs of mutant and control mice. Images are maximum intensity projections from equal-size image stacks encompassing stereocilia and the cuticular plate. Phalloidin fluorescence in the cuticular plate of 16-kHz OHCs is comparable in the two genotypes (M and N). In contrast, the fluorescence is strongly reduced (arrow) in 45-kHz OHCs in mutant mice (O and P). (O′, P′) Myosin 7a immunostaining (red) and DAPI counterstain (blue) show comparable cell and nuclear morphologies, excluding the possibility that the F-actin abnormalities are a sign of cell degeneration. (Q, R, S, T) Quantification of the phalloidin fluorescence intensity data: Normalized mean intensity ± SD of fluorescence in the cuticular plates of 16-kHz (S) and 45-kHz (T) OHCs in mutant and control mice are shown as horizontal bars with whiskers. Data points represent normalized phalloidin intensity values in the cuticular plate of single OHCs. In the 16 kHz region, the mean phalloidin intensity is not significantly different between the genotypes. The difference is statistically significant in the 45 kHz region, mutants showing strongly reduced phalloidin compared to controls. 16 kHz P = 0.507; 45 kHz P = 0.045, linear mixed model, type 3 test of fixed effect (genotype). Animals (cochleas) per group: control n = 3, cKO n = 3. *P < 0.05; N.S, not significant. (S, T) Phalloidin fluorescence comparison shown in IHC cuticular plates (oval sectors, arrows) in the 45-kHz region of mutant and control mice. (U, V) TEM sections through the apical part of 45-kHz OHCs show a strongly electron-dense cuticular plate in control specimen, whereas this structure has a weak appearance in mutant specimen. Note also OHC stereocilia fusion in the mutant specimen. Abbreviations: B6, C57BL/6J strain; cKO, conditional knock out; cp, cuticular plate; Ctrl, control; IHC, inner hair cell; Myo6, myosin 6; OHC, outer hair cell; PTPRQ, Protein Tyrosine Phosphatase Receptor Type Q; TEM, transmission electron microscopy. Scale bars: (A) 5 μm A, C, E, G, I, K; (B) 1 μm B, D, F, H, J, L; (M) 5 μm M-P’; (S) 5 μm S, T; (U) 1 μm U, V.

