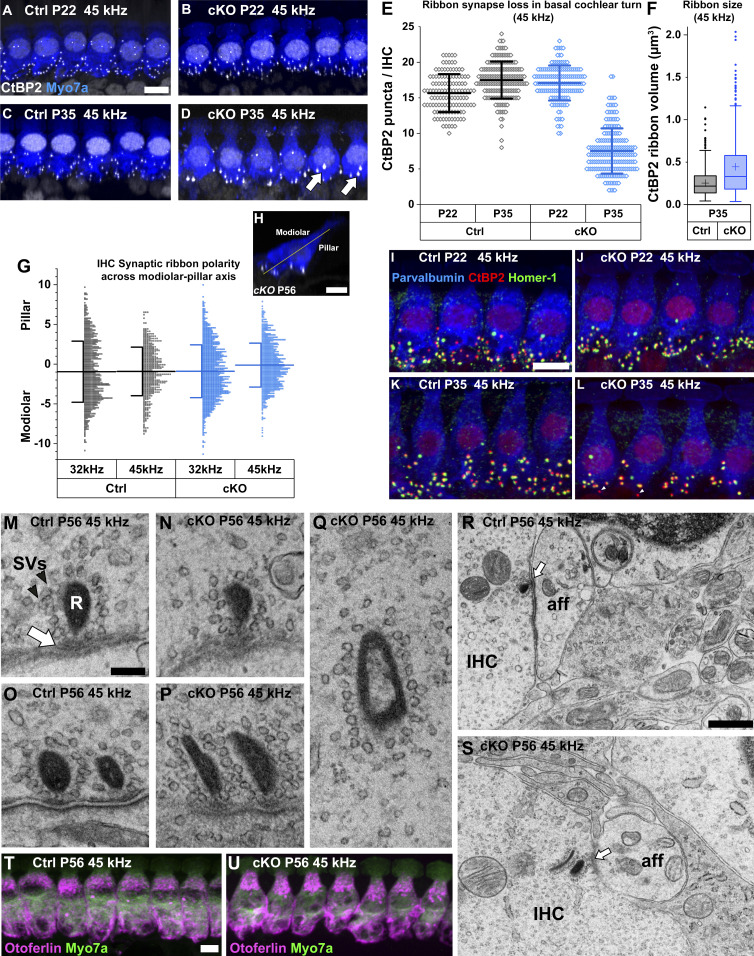
Figure 8. Pre- and postsynaptic defects in the ribbon synapses of inner hair cells in Manffl/fl;Pax2-Cre B6 mice.
(A, B, C, D) Double-immunostaining for the hair-cell-marker myosin 7a (blue) and the presynaptic ribbon-marker CtBP2 (white puncta) show that the CtBP2 puncta became reduced in number in the 45-kHz inner hair cells (IHCs) of cKO mice between P22 and P35, in contrast to controls. Many of the remaining puncta at P35 appear abnormally large (arrow). IHCs are illustrated as maximum intensity projections of z-stacks spanning from the apical neck region to the basal end of IHCs. (E) The two genotypes do not show differences in ribbon numbers in the 45-kHz IHCs at P22, unlike at P35 when about half of ribbons are lost in mutants. P22: P-value 0.216 (linear mixed model, type 3 test of fixed effect, genotype); estimated marginal means control 15.581, cKO 16.948; estimate of difference 1.367, control 95% CI [13.713, 17.449], cKO 95% CI [15.331, 18.566]. P35: P-value 0.045 × 10⁻³; estimated marginal means control 17.064, cKO 7.618; estimate of difference 9.446, control 95% CI [15.140, 18.989], cKO 95% CI [5.697, 9.539]. Animals (cochleas) per group: P22 control n = 4, P22 cKO n = 5, P35 control n = 6, P35 cKO n = 5 (20-30 IHCs per cochlea). Data points represent single IHCs. Horizontal bars represents mean of all IHCs in a given group, error bars represent ± SD. (F) The volumes of CtBP2-positive presynaptic ribbons from the 45-kHz cochlear region at P35, shown as box-and-whiskers plots. Box covers the second quartile, whiskers extend to 1.5× the interquartile range. Horizontal line denotes the median and cross denotes the mean. Outliers are shown as individual data points. The distribution is significantly different between the genotypes (Kolmogorov–Smirnov test, P < 0.001, n = 3 animals per group, 823 and 397 synapses analysed in the control and cKO groups, respectively). (G, H) The positions of ribbon synapses across the IHC modiolar-pillar axis, illustrated in G, were quantified at P56. In the synaptopathic (45 kHz) region of mutant cochleas, there was a small shift in mean ribbon position toward the pillar side, but variability within the groups was high and the difference between the genotypes did not reach significance. A non-synaptopathic region (32 kHz) did not show any shift or difference in mean ribbon positions between control and mutant mice. 32 kHz: P-value 0.582 (linear mixed model, type 3 test of fixed effect, genotype); estimated marginal means control −1.051, cKO −0.809; estimate of difference 0.242, control 95% CI [-1.565, −0.537], cKO 95% CI [-1,180, −0.437]. 45 kHz: P-value 0.263; estimated marginal means control −0.963, cKO −0.145; estimate of difference 0.816, control 95% CI [-2,247, 0.321], cKO 95% CI [-1,261, 0.972]. Animals (cochleas) per group: Control n = 3, cKO n = 4. Horizontal bars represent the mean value of pooled measurements from all mice in a given group, error bars represent ± SD. Data points represent the distance of single ribbons from the modiolar-pillar axis (in μm). Negative sign denotes modiolar side, positive denotes pillar side. (I, J, K, L) Triple-immunostaining for parvalbumin (hair cell marker, blue), CtBP2 (red), and Homer1 (post-synaptic receptor marker, green) shows that the 45-kHz IHCs in mutant mice that lose ribbons also lose at least an equal amount post-synaptic receptors between P22 and P35 (K). Unpaired “orphan” ribbons (arrowhead) were often seen in the IHCs of P35 mutant mice. Quantification of these findings is detailed in results. (M, N, O, P) TEM sections show that the high-frequency IHCs of both genotypes exhibit single as well as double ribbons at the synaptic active zone (arrow), with numerous synaptic vesicles (arrowhead) tethered to the ribbon plaque. (Q) Ribbons surrounded by synaptic vesicles can be found “free-floating” in the IHC cytoplasm in P56 cKO mice. (R, S) In both controls and mutants at P56, the terminals of spiral ganglion neurons at the basal end of high-frequency IHCs lacked signs of swelling. (T, U) Double-immunostaining for myosin 7a (green) and otoferlin (magenta) shows comparable otoferlin expression in the 45-kHz IHCs in the two genotypes at P56. IHCs are illustrated as maximum intensity projections of z-stacks spanning the entire IHCs. Abbreviations: aff, afferent nerve terminal; B6, C57BL/6J strain; CI, confidence interval; cKO, conditional knock out; CtBP2, C-terminal Binding Protein 2; Ctrl, control; IHC, inner hair cell; R, ribbon plaque; SVs, synaptic vesicles; TEM, transmission electron microscopy. Scale bars: (A) 5 μm A-D; (G) 5 μm G; (H) 5 μm H-K; (L) 100 nm L-P; (Q) 500 nm Q, R; (S) 5 μm S, T.

