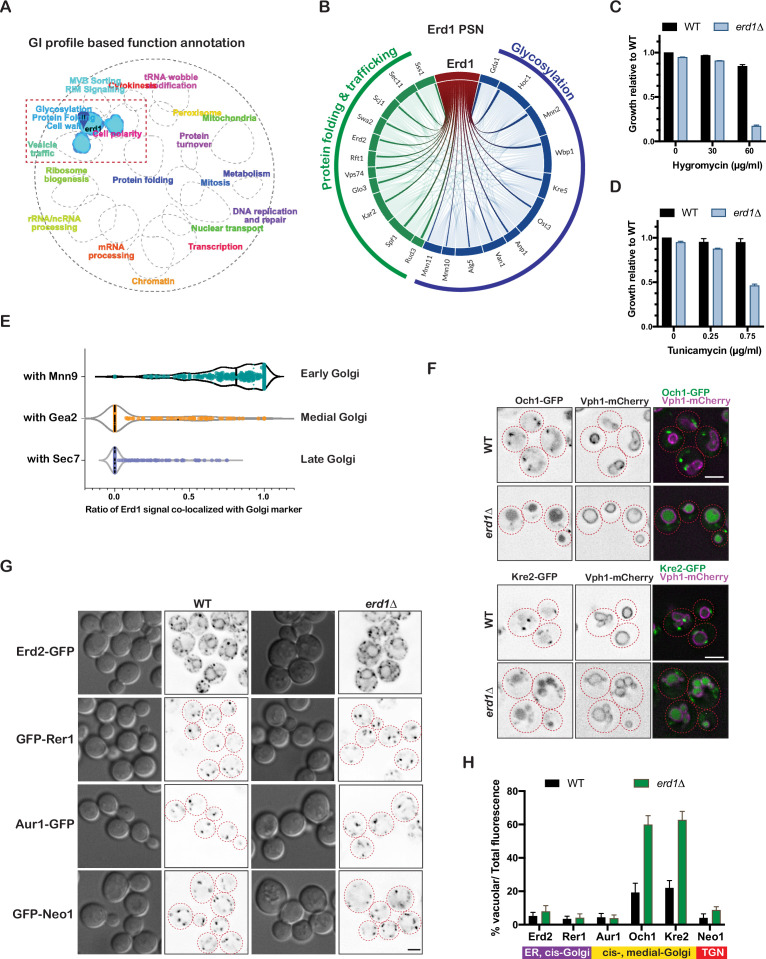
Figure 1. Erd1 is required for Golgi protein glycosylation.
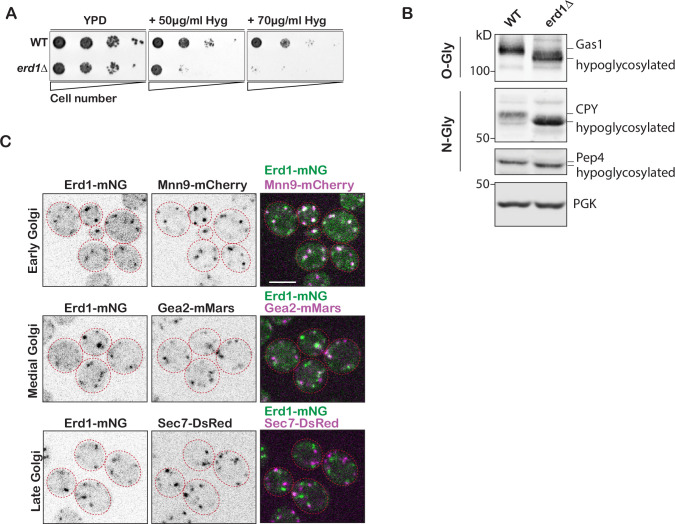
(A) Spatial analysis of functional enrichment (SAFE) analysis based on the genetic interaction profile of erd1 mutant (stringent cut-off (p < 6e-11)). (B) Profile similarity network (PSN) of Erd1 showing genes with similar genetic interactions (similarity cut-off 0.25). (C) Growth of wild type and erd1 mutant in the presence of indicated concentrations of HygromycinB in YPD liquid cultures at 30° C after 24 hr. (D) Sensitivity of wild type and erd1 mutant to indicated concentrations of Tunicamycin in YPD liquid cultures at 30° C. (E) Violin plots for the ratio of co-localized Erd1-mNeonGreen fluorescence with early (Mnn9-mCherry), medial (Gea2-3xmMars), and late (Sec7-6xDsRed) Golgi markers (n = 250 puncta for each condition). The median is indicated with dashed lines. (F) Live-cell fluorescence imaging of Och1-GFP, Kre2-GFP, and vacuole membrane marker (Vph1-mCherry) in wild type and erd1 mutant. Red dashed lines indicate the cell boundaries based on DIC images. (G) Live-cell fluorescence imaging of Erd2-GFP, GFP-Rer1, Aur1-GFP and GFP-Neo1 in wild type and erd1 mutant. (H) Quantification of the percent vacuolar to total GFP fluorescence for reporters in (F) and (G). Scale bars: 2.5µ m.


