. 2021 Oct 25;10:e70129. doi: 10.7554/eLife.70129

Figure 4. Coefficient of partial determination (CPD) and mutual information (MI) reveal broad encoding of all task parameters in each cluster.

(A) CPD for choice and reward outcome encoding: Reward history panels quantify encoding of outcome on the previous trial (previous win/loss/opt out), choice panels convey encoding of choices on the current trial (left/right), and reward panels quantify encoding of outcomes on the current trial (win/loss). (B) Mutual information for same task parameters. (C) CPD of flashes (left panels) and clicks (right panels) that encode reward probability and reward volume, respectively. CPD and MI values are averaged over neurons in each cluster; error bars show s.e.m. Results for PSTH clustering are in the left columns, and results for conditional clustering are in the right columns.

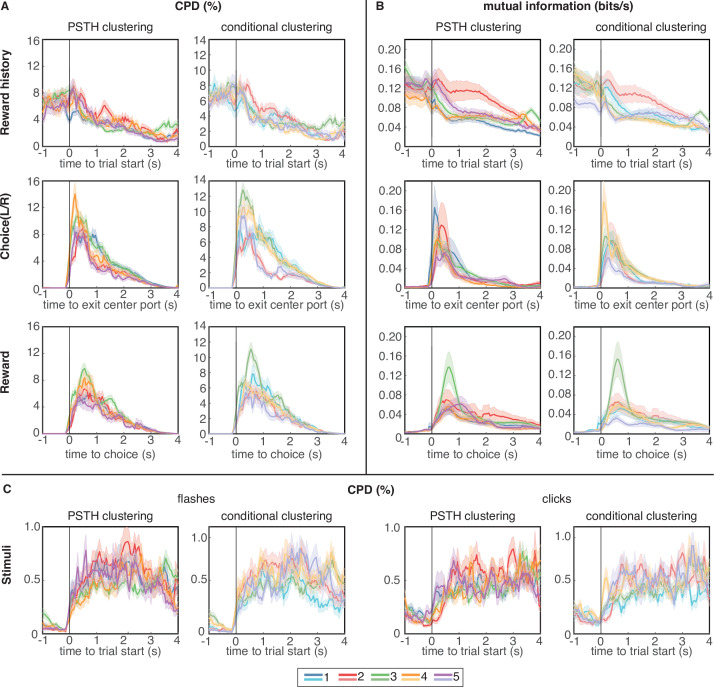
Figure 4.

Figure 4—figure supplement 1. Waveform analysis.

Figure 4—figure supplement 1.

Waveform action potential (AP) and after-hyperpolarization (AHP) widths are equally distributed across clusters. (A) The half-width of the AP peak (black), and full width of the AHP trough (red) were taken as key features of the waveform from each neuron. Waveforms were standardized by mean-subtracting and normalizing by the maximum amplitude range. (B) AP and AHP for the population of units clustered into two putative groups: Regular spiking units (RSU, solid circles), and fast spiking units (FSU, open circles). (C) Probability of an RSU or FSU neuron occurring in each N = 5 clusters from the PSTH-based clustering labeling. Error bars denote the 95% binomial distribution confidence interval. The means of the two putative FSU and RSU clusters were significantly different (μRSU=4.65Hz, μFSU=9.66Hz, p§lt;10-4, signed-rank test, not shown).