. 2021 Oct 25;10:e70129. doi: 10.7554/eLife.70129

Figure 6. Adaptive value coding analysis using linear regression of firing rates for the 1s period following reward delivery against current and previous reward outcomes.

(A) Regression coefficients for the current reward outcome, cwin/loss (parameterized as win = 1, and loss=-1), and previous trial outcome, crewhist. 180 neurons had significant coefficients for both regressors (p§lt;0.05, t-test), and 81 neurons had coefficients with opposite signs, consistent with adaptive value coding (blue dots). The remaining neurons have differential responses due to reward history, but inconsistent with adaptive value coding (red crosses). (B) Probability that a model with significant regressors for both current and past reward outcome would come from a given cluster. Shaded regions denote all models from panel A, and blue bars show the probability for adaptive neurons only. Error bars are the 95% confidence interval of the mean for a binomial distribution with observed counts from each cluster. (C) Example cell demonstrating adaptive value coding. Shaded gray region denotes time window used to compute mean firing rate for the regression. (D) Sample cell demonstrating significant modulation due to reward history, but with a relationship inconsistent with adaptive value coding.

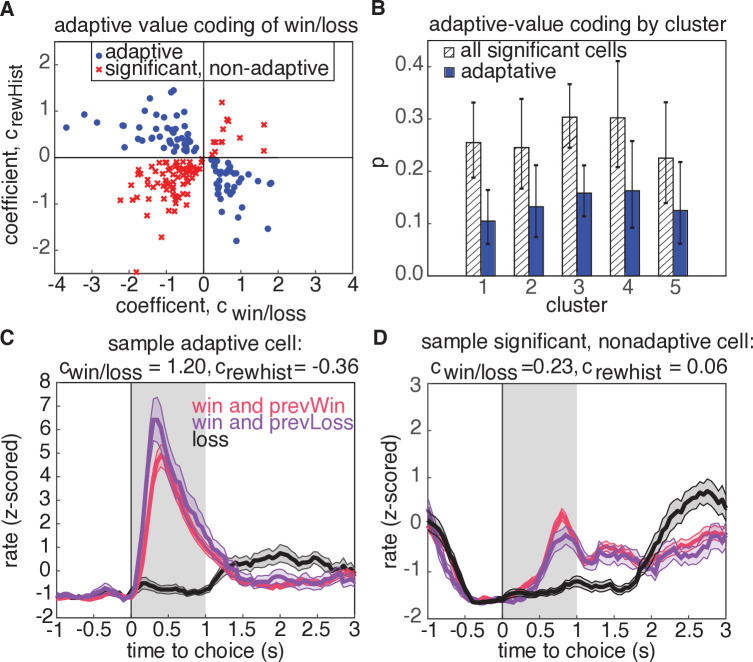
Figure 6.

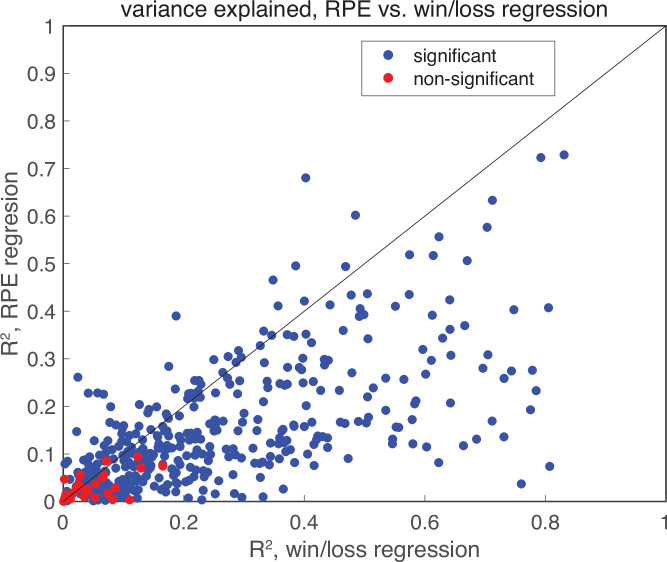
Figure 6—figure supplement 1. Linear regression of RPE.

Figure 6—figure supplement 1.

Linear regression of RPE in the post-choice epoch indicates that no RPE is present. Plotted is the variance explained for each neuron for two separate models: the binary win/loss model analyzed in Figure 6, and an equivalent model that replaces the current trial win/loss and past trial win/loss regressors with an RPE regressor. Blue dots indicate models with significant linear models, while red dots indicate non-significant models (threshold p§lt;0.05, F-test). The binary win/loss model captures more variance than the RPE model, indicating that wins and losses better explain that data. Further, model comparison between the two models by held out data log-likelihood reveals that the win/loss model is a better model (median ΔNLL=-5.9, p§lt;10-4, Wilcoxon signed rank test). The large proportion of RPE models that are significant is likely a reflection of the high correlation between RPE and win/loss regressors (ρ=0.80).
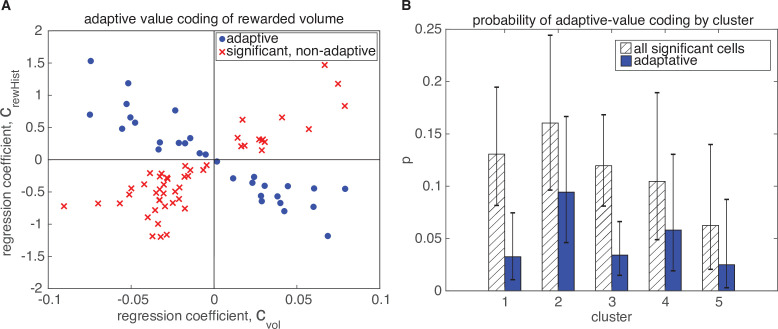
Figure 6—figure supplement 2. Adaptive value coding of rewarded volume.

Figure 6—figure supplement 2.

Adaptation of rewarded volume representation is present in fewer neurons than the reward outcome representation, but is still distributed across all clusters. Figure convention is similar to Figure 6.