. 2021 Nov 25;10:e69418. doi: 10.7554/eLife.69418

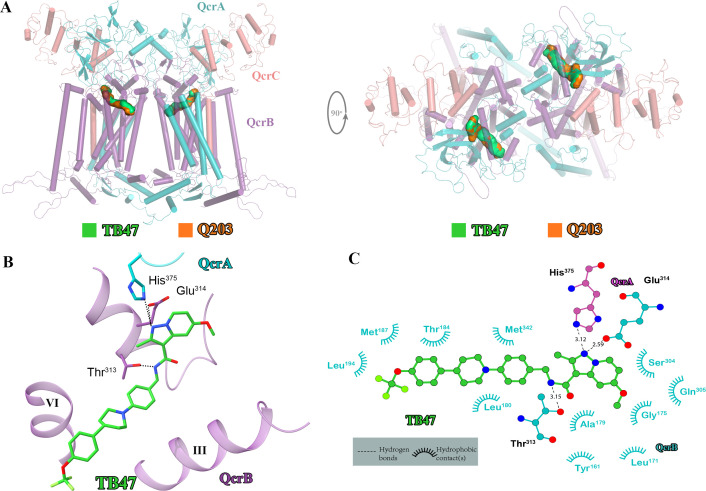
Figure 5. Cryo-electron microscopy (cryo-EM) structure of the hybrid supercomplex in the presence of TB47.

(A) Side (left) and top (right) views of the cryo-EM structure of the M. tuberculosis cytochrome bcc complex presented as a cartoon representation. TB47 (green) and Q203 (orange) are bound to the Qp site. (B) Visualization of the density for TB47. Hydrogen bonds are shown as dotted lines. (C) Plot of distances of various parts of TB47 to residues in the Qp site were determined using LIGPLOT (https://www.ebi.ac.uk/thornton-srv/software/LIGPLOT/).

Figure 5.

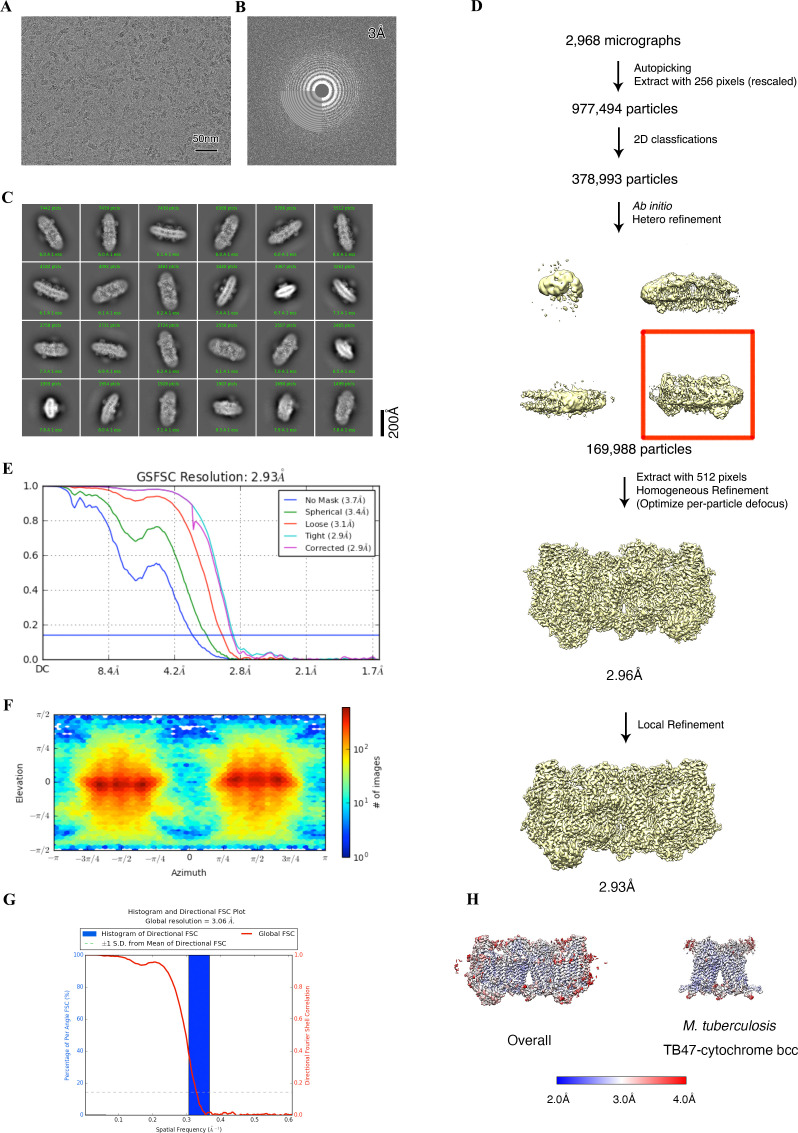
Figure 5—figure supplement 1. Cryo-electron microscopy (cryo-EM) data processing of the hybrid supercomplex consisting of M. tuberculosis CIII and M. smegmatis CIV in the presence of TB47.

Figure 5—figure supplement 1.

(A) Representative electron micrograph of the cryo-EM sample. (B) CTF fit of motion-corrected micrographs (C) Representative 2D classification averages calculated from selected particles. (D) Workflow of the data processing for the TB47-bound hybrid supercomplex. (E) Fourier shell correlation (FSC) curves of 3D reconstructions. (F) Viewing direction of all particles used in the final 3D reconstruction. (G) 3D FSC histogram of final map. (H) The overall and M. tuberculosis cytochrome bcc maps, colored according to the local resolution.
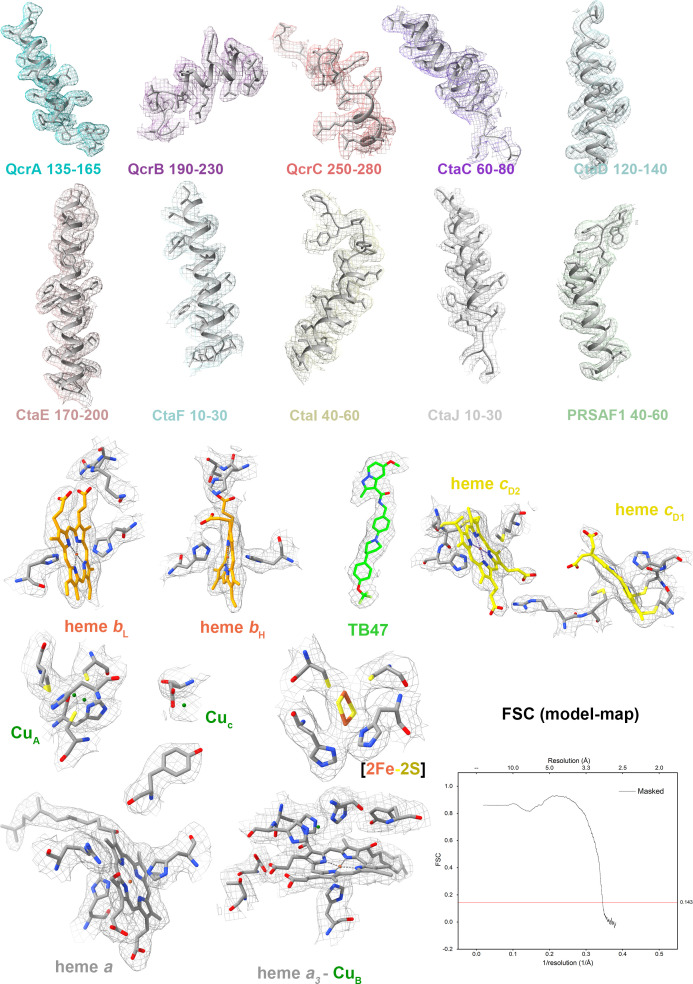
Figure 5—figure supplement 2. Cryo-electron microscopy (cryo-EM) map quality assessment for the hybrid M. tuberculosis cytochrome bcc complex.

Figure 5—figure supplement 2.

Representative cryo-EM densities and structures of individual subunits, prosthetic groups, and inhibitors. Map-model Fourier shell correlation (FSC).
Figure 5—figure supplement 3. The densities for TB47 and QcrBTyr164.
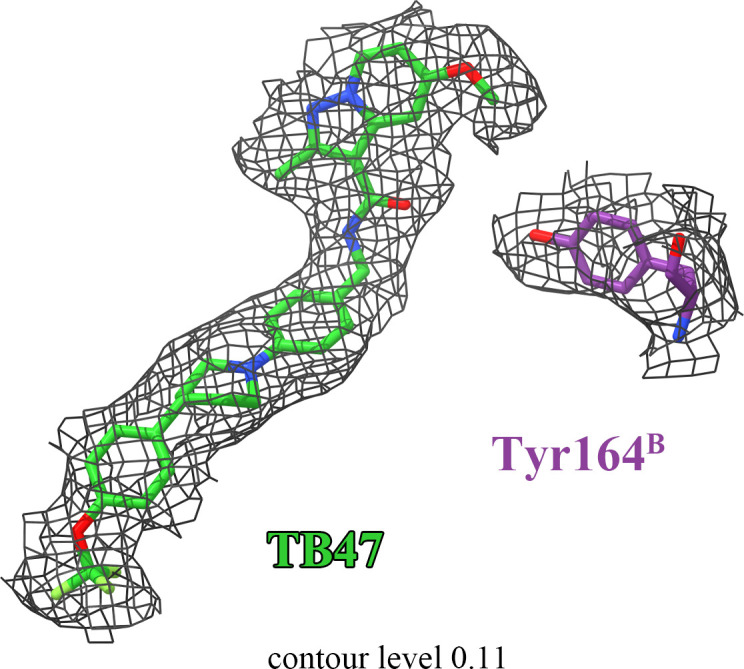
Figure 5—figure supplement 3.

There is no density linking TB47 and QcrBTyr164.
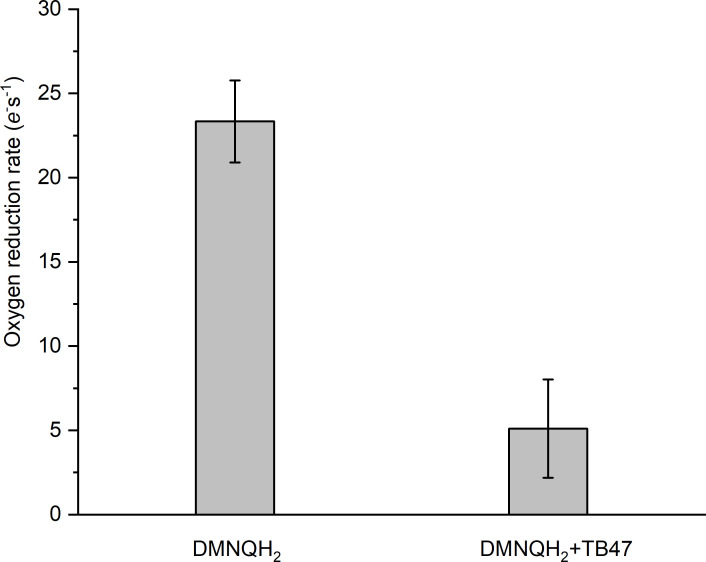
Figure 5—figure supplement 4. Rate of O2 reduction by the hybrid supercomplex before and after addition of TB47.

Figure 5—figure supplement 4.

Data shown are mean ± SD; n = 4 measurements.
Figure 5—figure supplement 4—source data 1. Oxygen consumption of the hybrid supercomplex after addition of TB47 measures using Clark-type oxygen electrode.
Figure 5—figure supplement 5. Reported mutations in TB47-resistant M. tuberculosis.
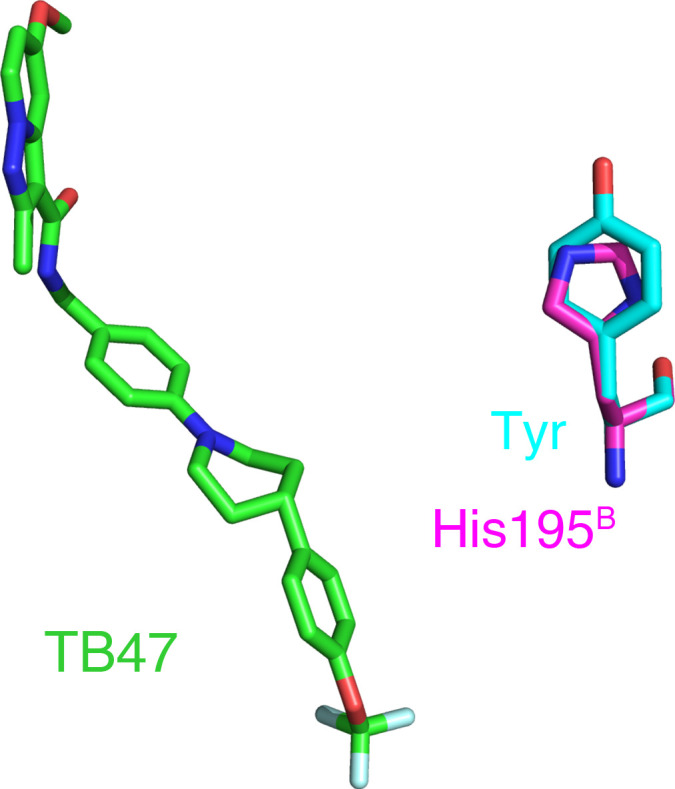
Figure 5—figure supplement 5.

The native and mutant residues are colored magenta and cyan, respectively.