. 2021 Nov 10;10:e62567. doi: 10.7554/eLife.62567

Figure 4. MBON-m1 receives functional inputs from LH and MB.

(a) MBON and LHN inputs onto MBON-m1 revealed by EM reconstruction. (b) Calcium activity of MBON-m1 in response to an innately attractive odor (EA) (c) and/or to optogenetic activation of CsChrimson-expressing KCs (d) was imaged in vivo in first instar larvae immobilised in a microfluidic chip as in Si et al., 2019. (c–e) Plots show fluorescence normalized to baseline (prior to odor presentation, δF/F0). Scores are calculated for the first 3 s of odor presentation. *: p < 0.05, **: p < 0.01, ***: p < 0.001, Wilcoxon test. See Figure 4—figure supplement 2 for individual animal responses. (c) Left, In untrained larvae MBON-m1 is excited by the innately attractive odor (N = 12). Middle, Silencing the MB pathway (by expressing TNTe in KCs) does not impair the excitatory response of MBON-m1 to the innately attractive odor (N = 6). This confirms a functionally excitatory connection from LHNs to MBON-m1. Right, quantification shows significant MBON-m1 responses to odor in the presence (left) and absence (middle) of a functional MB pathway. The comparison suggests that in the naive animals the excitatory odor drive could come mainly from the LH pathway. (d) Across the population of untrained larvae, the average change in δF/F0 in response to optogenetic activation of KCs is not significantly different from 0. However, the amplitude of δF/F0 (|max δF/F0 - min δF/F0|) was significantly increased after, compared to before, KC activation, suggesting that MBON-m1 receives functionally excitatory inputs from the MB in some individuals, and inhibitory in others (N = 12). (e) Activation of KCs in brain explants together with pharmacological blockers confirm mixed inhibitory and excitatory inputs from the MB pathway (N = 9). In saline, MBON-m1 response to KC activation does not differ from zero, with excitatory or inhibitory responses depending on individuals (inset shows the amplitudes of the responses significantly differ from zero). However, when bathed with PTX, thereby blocking chloride gating GABA and glutamate receptors, MBON-m1 is robustly excited by KC activation. Bath with MCA mostly abolishes the response to KC activation.

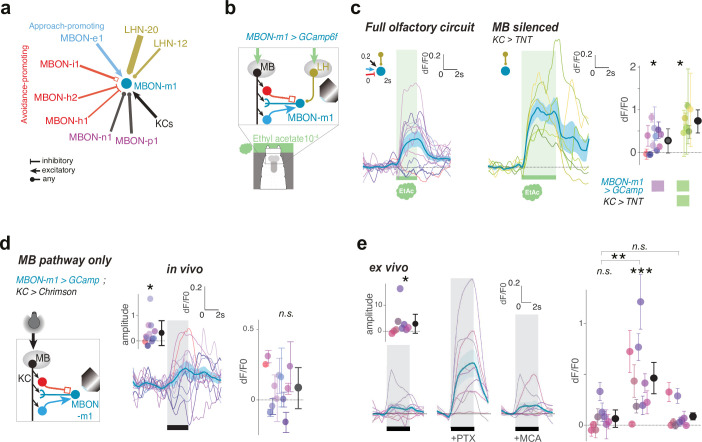
Figure 4—source data 1. Individual GCaMP fluorescence values in response to odour presentation by MBON-m1 of animals with intact olfactory pathway.
Fluorescence values of the ROI over time for each repeats and each individuals as plotted in Figure 4c (left panel).
Figure 4—source data 2. Individual GCaMP fluorescence values in response to odour presentation by MBON-m1 of animals with silenced MB.
Fluorescence values of the ROI over time for each repeats and each individuals as plotted in Figure 4c (right panel).
Figure 4—source data 3. Individual GCaMP fluorescence values in response to Kenyon cells optogenetic activation by MBON-m1.
Fluorescence values of the ROI over time for each repeats and each individuals as plotted in Figure 4d.

Figure 4.

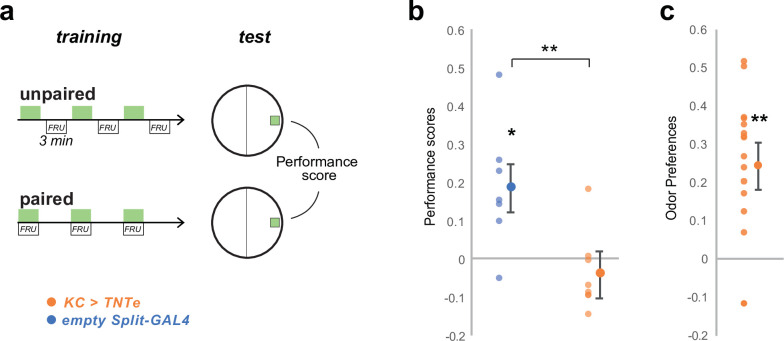
Figure 4—figure supplement 1. Silencing KC impairs olfactory memory performances but maintains olfactory perception.

Figure 4—figure supplement 1.

We verified that silencing KCs with TNTe (KC> TNTe) as in Figures 4c and 6 impairs associative learning as a control to show that the same inactivation method is working. (a) We trained groups of 30 third-instar larvae in sets of two. For each pair, one group, the ‘paired group’, was presented with EA (green rectangles) and fructose-supplemented agar for three times 3-min-long pairing intercalated with 3 min of no odor and pure agar. The other group, the ‘unpaired group’, received EA for 3 min and fructose-supplemented agar for the three next min, three times with no overlapping. The two groups were then tested for their preference for EA, which was estimated by PrefEA = (NEA – Nair) / (NEA+ Nair), and a Performance Score was computed by subtracting the PrefEA in the ‘paired’ group to the PrefEA obtained in the ‘unpaired’ group. A positive score indicates appetitive memory, whereas a zero score indicates no memory. (b) The third-instar larvae with silenced KCs (KC> TNTe; N = 8) did not show appetitive short-term memory while the control line (empty Split-GAL4, N = 7) did. *: p < 0.05, **: p < 0.01, Wilcoxon test. Individual data points and mean ± s.e.m. are shown. (c) The experimental larvae (KC> TNTe N = 8) still exhibited attraction to the trained odor, indicating that learning performance was abolished, but odor navigation was not fully abolished. Statistics are the same as in b.
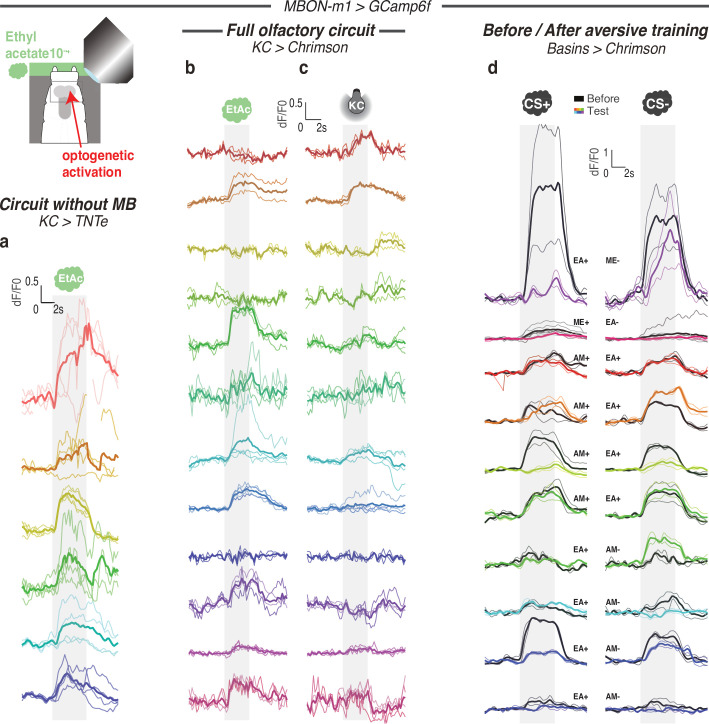
Figure 4—figure supplement 2. Calcium responses of MBON-m1 for each individual.

Figure 4—figure supplement 2.

Calcium activity of MBON-m1 was imaged in vivo (using SS02163-GAL4> UAS-GCamp6f) in first instar larvae immobilised in a microfluidic device (Si et al., 2019) and exposed to the odor EA (a,b,d) and/or to optogenetic activation of CsChrimson-expressing KCs (c,d). Each curve shows fluorescence normalized to baseline (before odor presentation) for each repeat (2–4) per animal (mean +/− s.e.m.). Each color corresponds to one individual, thicker curve is averaged response for this individual. In b-c responses in the same animal to different kinds of stimulations (odor or KC activation) are shown in the same color. Smoothed averaged individual responses are also shown in Figures 4c–d ,5a. (a) Response of MBON-m1 to EA in larvae with silenced MB (using 14H06-LexA> LexAop TNTe). (b) Response of MBON-m1 to EA in larvae with intact MB (in 14H06-LexA> LexAop-CsChrimson). (c) Response of MBON-m1 to activation of MB (using 14H06-LexA> LexAop-CsChrimson). (d) Response of MBON-m1 to two odors, CS+ and CS-, before (in black) and after (in color) the CS+ was paired with optogenetic activation of the nociceptive neurons Basins (olfactory aversive training).