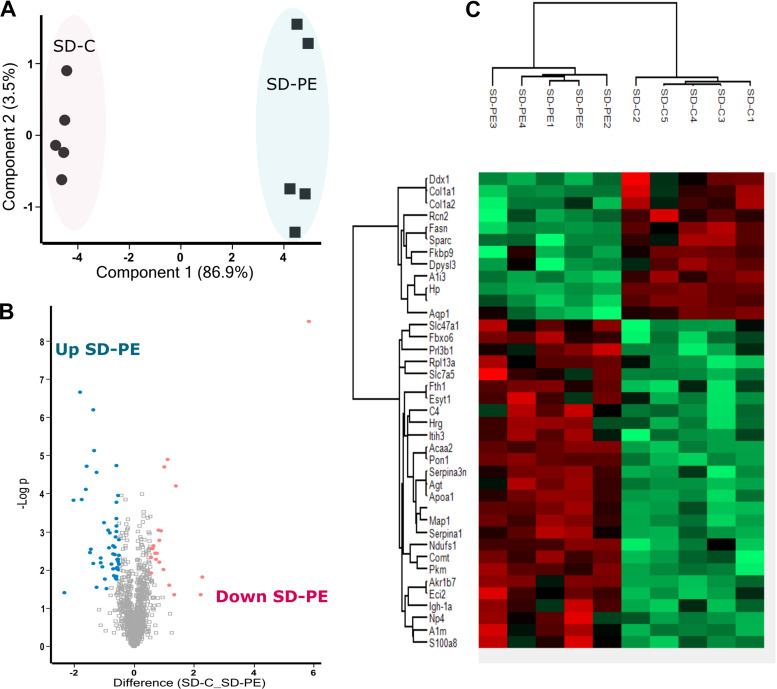
Figure 3.
Model 2 SD PE vs. SD control placenta proteome. A: principal component analysis plot of differentially expressed protein. Percentages represent variance captured by principal components 1 and 2. Circles represent SD control (SD-C) and square represents SD preeclamptic (SD-PE). B: volcano plot showing negative natural log of the P values plotted against the log(base2) of the change for each of the proteins quantified by label-free proteomic analysis comparing SD-C and SD-PE. Proteins were downregulated (P < 0.05) and upregulated (P < 0.05) in SD-PE colored pink and blue respectively. C: clustered heat map of differentially expressed protein label-free quantification (LFQ) profiles between SD-C and SD-PE after t test analysis. Red, increased protein expression; green, low relative to the other samples. SD, Sprague-Dawley.

