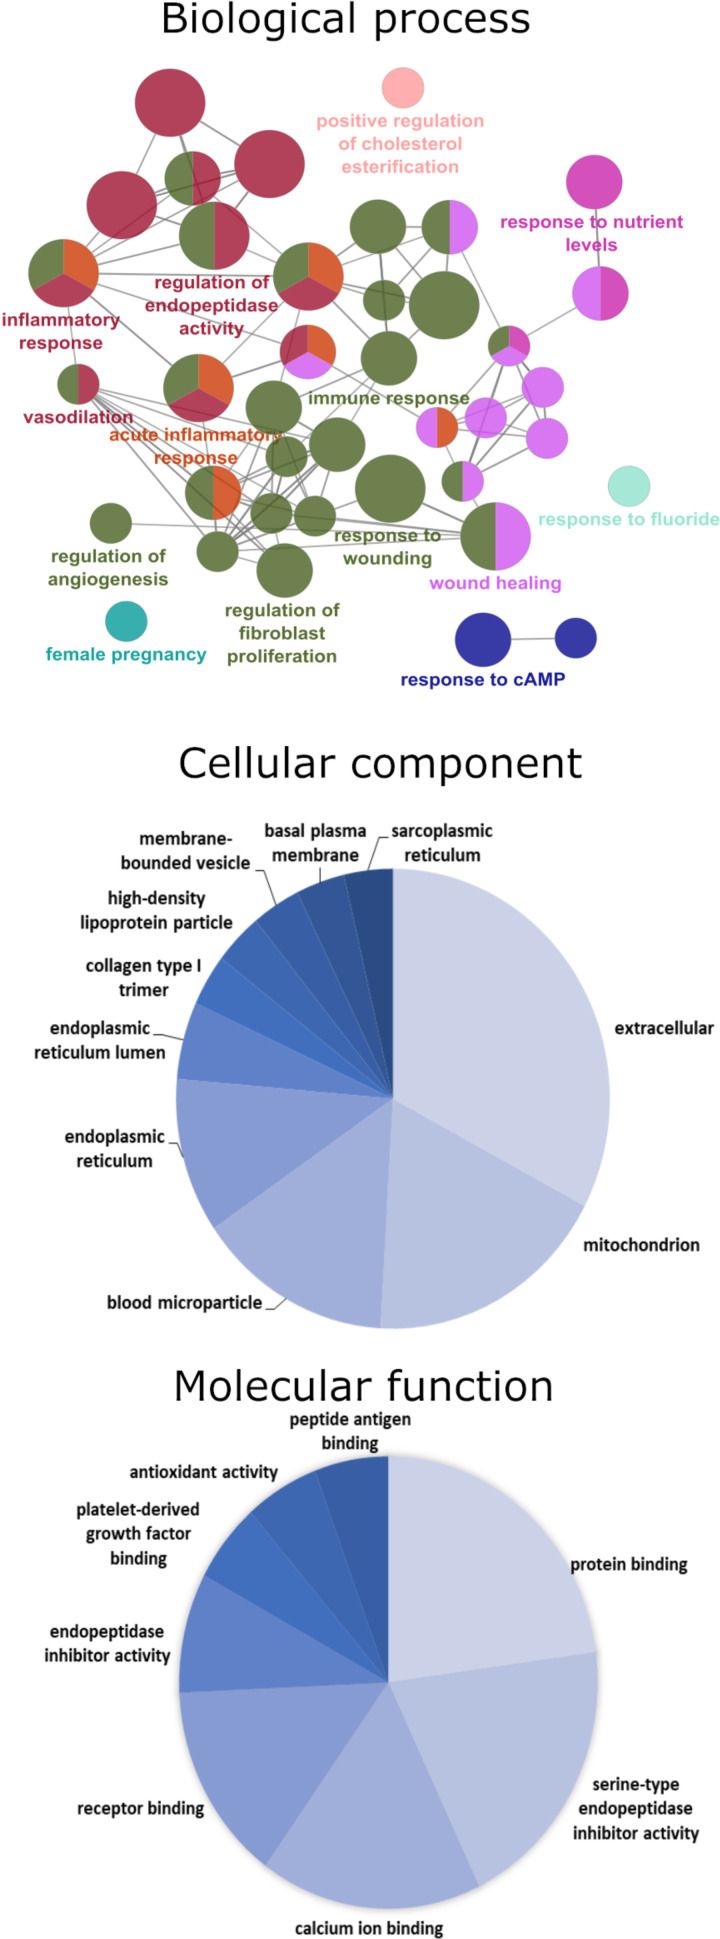
Figure 4.
Gene ontology for model 2 SD preeclamptic (SD PE) vs. SD control placenta proteome. Enrichment of gene ontology (GO) was done using the ClueGo plugin in Cytoscape software. GO analysis for differentially expressed protein (up- and downregulated combined) was performed for the enrichment of GO terms for biological process (top: ClueGo network), cellular component (middle: pie chart), and molecular function (bottom: pie chart). In biological process enrichment network, each circle represents a node (specific GO biological process), different color symbolizes a different biological process and size of node represents P value of enrichment of the GO term (smaller indicated by larger node size). The mixed color of node specifies the involvement of proteins in multiple biological processes. The connection between the two nodes (edge) indicates that the two biological process share proteins. SD, Sprague-Dawley.

