Figure 6.
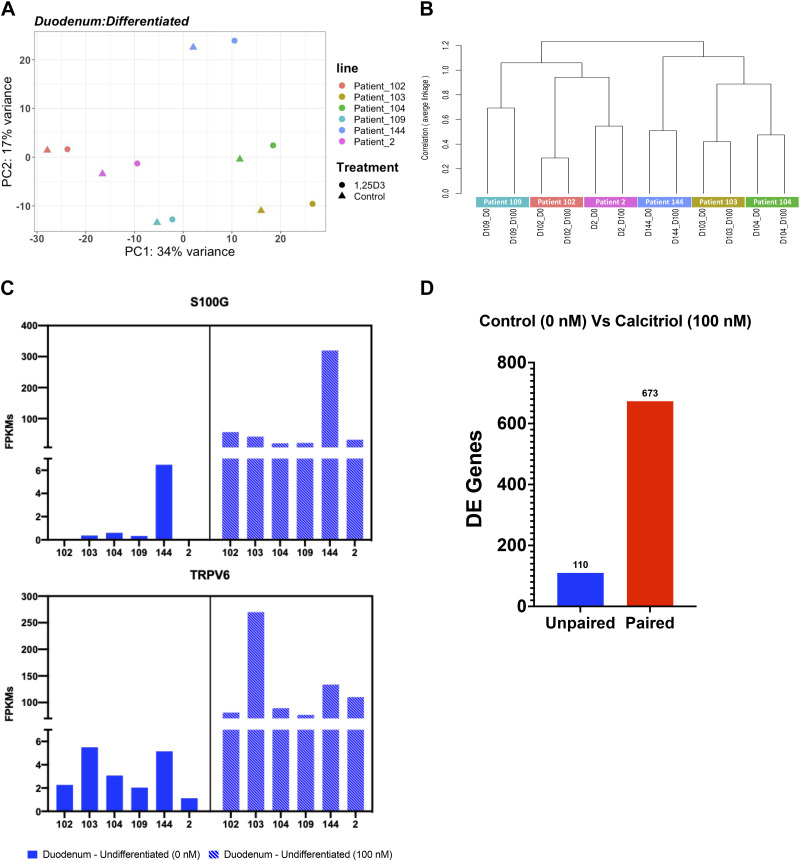
Patient-to-patient variability results in variable basal gene expression and response to stimuli. A: principal component analysis (PCA) of the RNA-sequencing datasets for three-dimensional (3-D) differentiated duodenal enteroids (n = 12) with six patient samples indicated by six different colors. B: a dendrogram with agglomerative hierarchal clustering of the 3-D differentiated duodenal gene set from RNA-sequencing. Branch length indicates degree of difference between samples. C: normalized fragments per kilobase of transcript per million mapped reads (FPKMs) of S100G (top) and TRPV6 (bottom) expression in individual differentiated 3-D duodenal enteroids lines comparing the gene expression level between the control group (0 nM, solid) and the calcitriol treatment group (100 nM, dashed). Gene expression was upregulated upon the calcitriol treatment with a false discovery rate ≤ 1% (0.01). D: the number of differentially expressed (DE) genes that were output from DESeq2 as a result of using an unpaired (blue) or paired (red) experimental design.

