Figure 1.

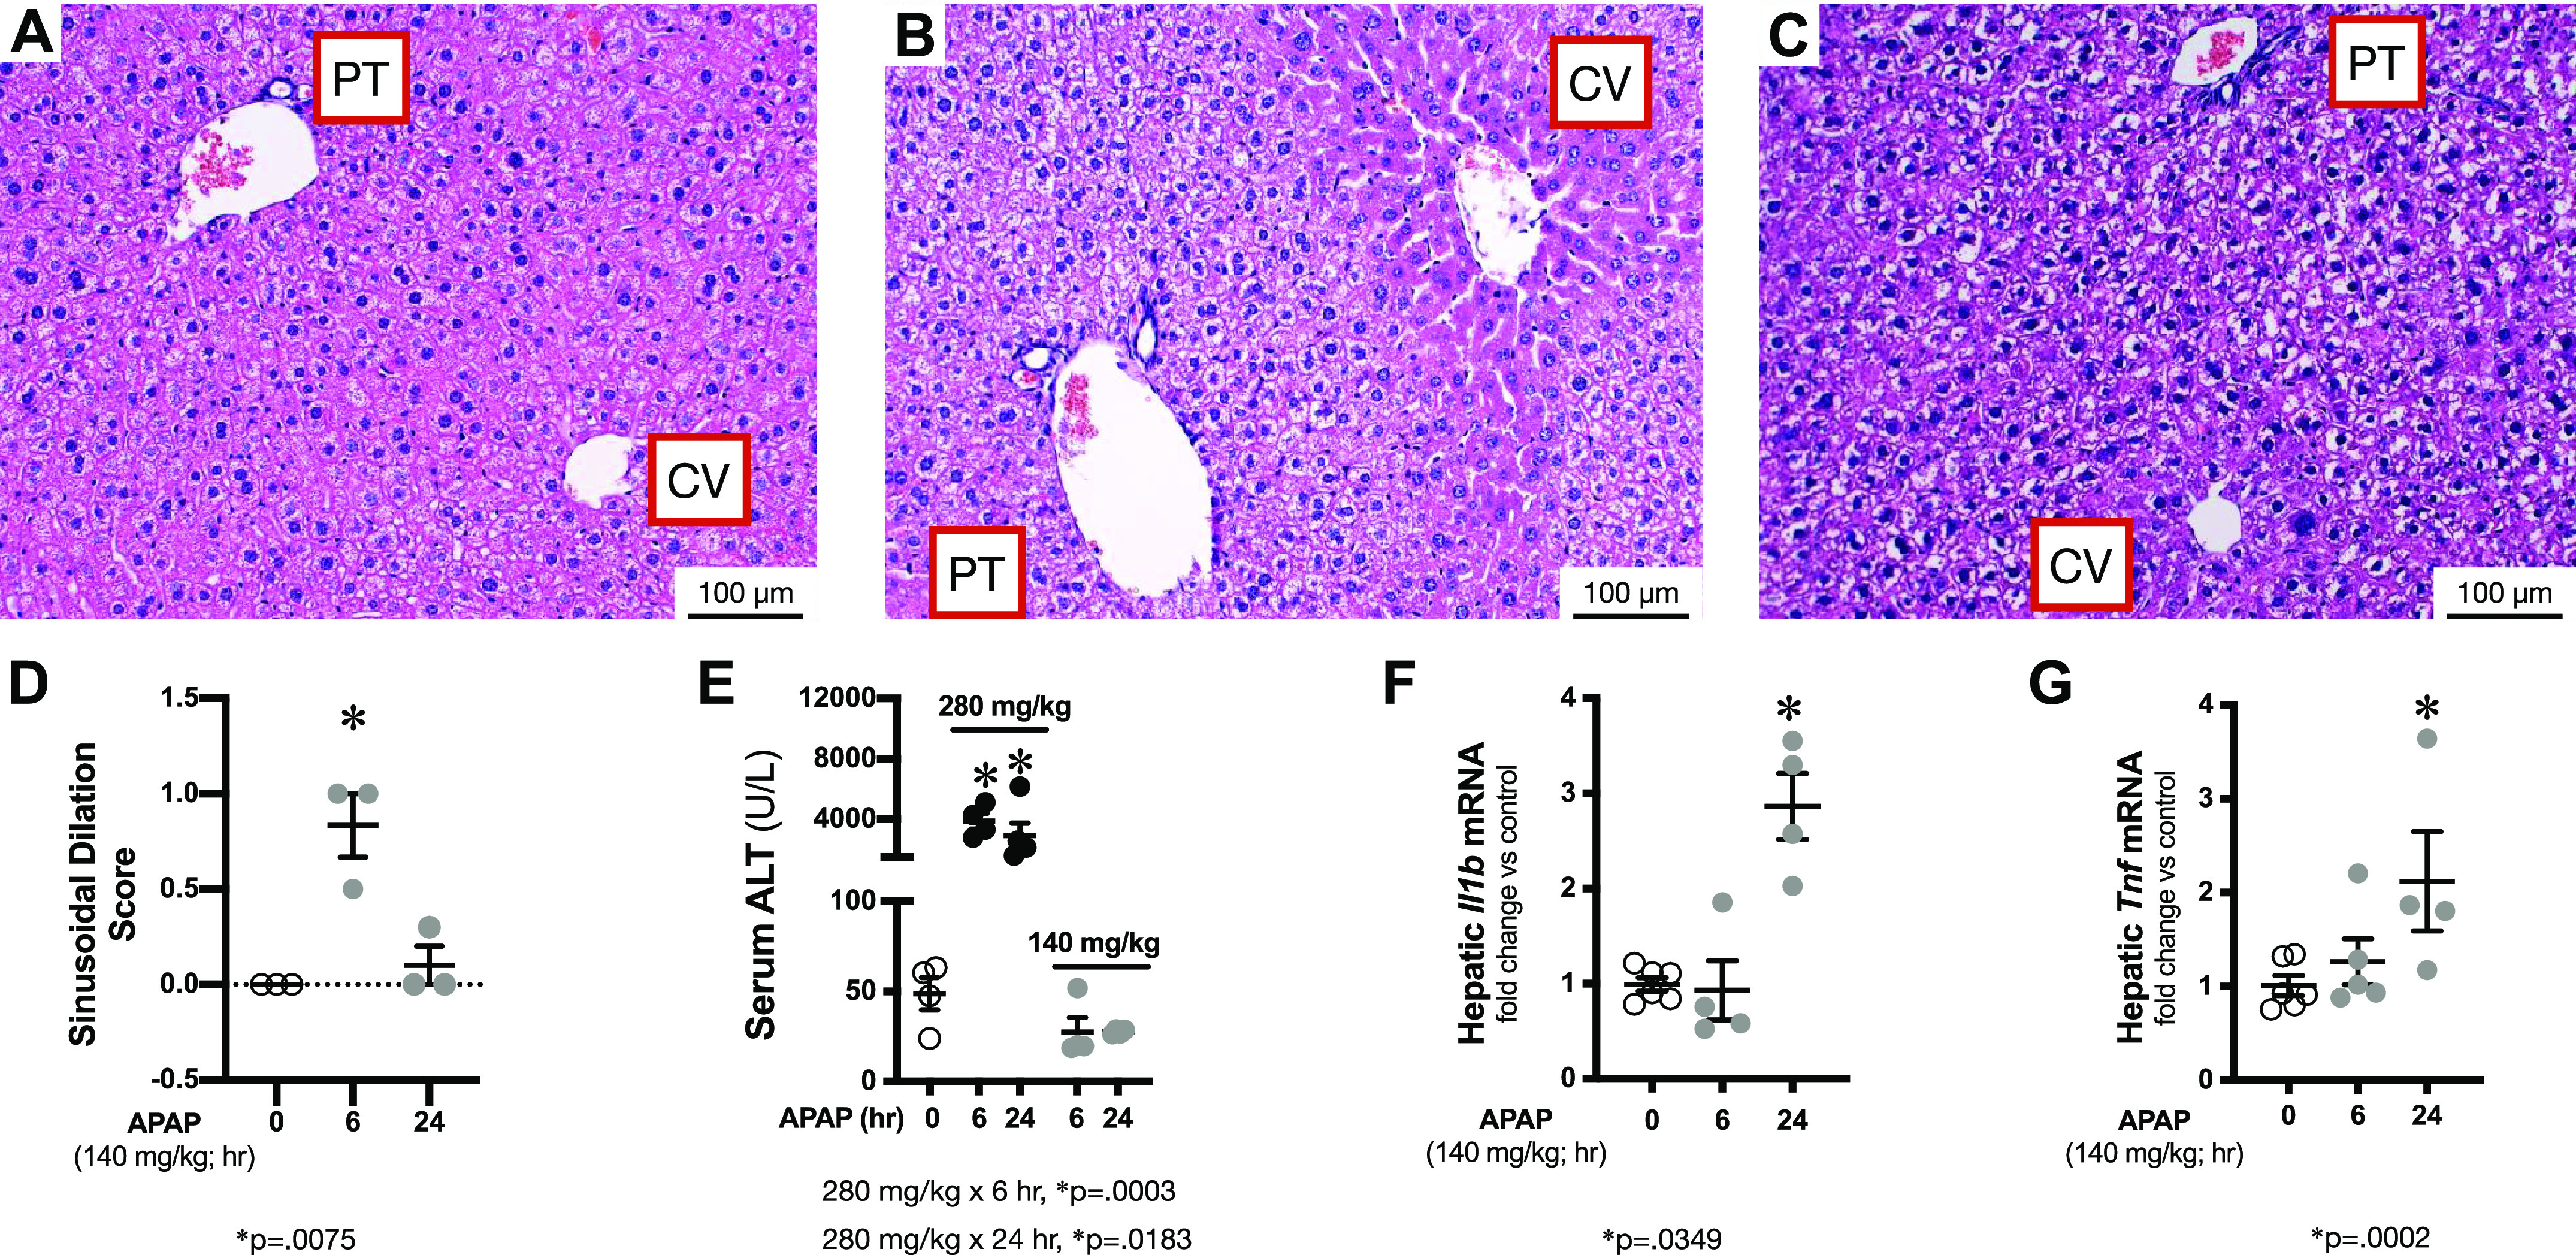
Time course of APAP-induced hepatic injury in ICR mice. A–C: representative H&E stained hepatic sections from control and APAP (140 mg/kg, ip) exposed (B: 6 h; C: 24 h) adult male ICR mice. Examples of portal triad (PT) and central vein (CV) have been added. Internal scale bar = 100 μm. D: blinded histopathological evaluation of H&E stained hepatic sections scored for sinusoidal dilatation. N = 3 per time point. Data are expressed as means ± SE; *P < 0.05 vs. unexposed control. E: serum ALT following APAP exposure (140 or 280 mg/kg ip; 6 or 24 h). N = 4 animals per time point. Data are expressed as means ± SE; *P < 0.05 vs. unexposed control. F and G: fold change in hepatic mRNA expression of (F) Tnf (tumor necrosis factor) and (G) Il1b (interleukin 1β) following APAP exposure (140 mg/kg, ip; 6 or 24 h) Data expressed as means ± SE (N = 4 animals per time point). *P < 0.05 vs. unexposed control. ALT, alanine transaminase; APAP, acetaminophen.
