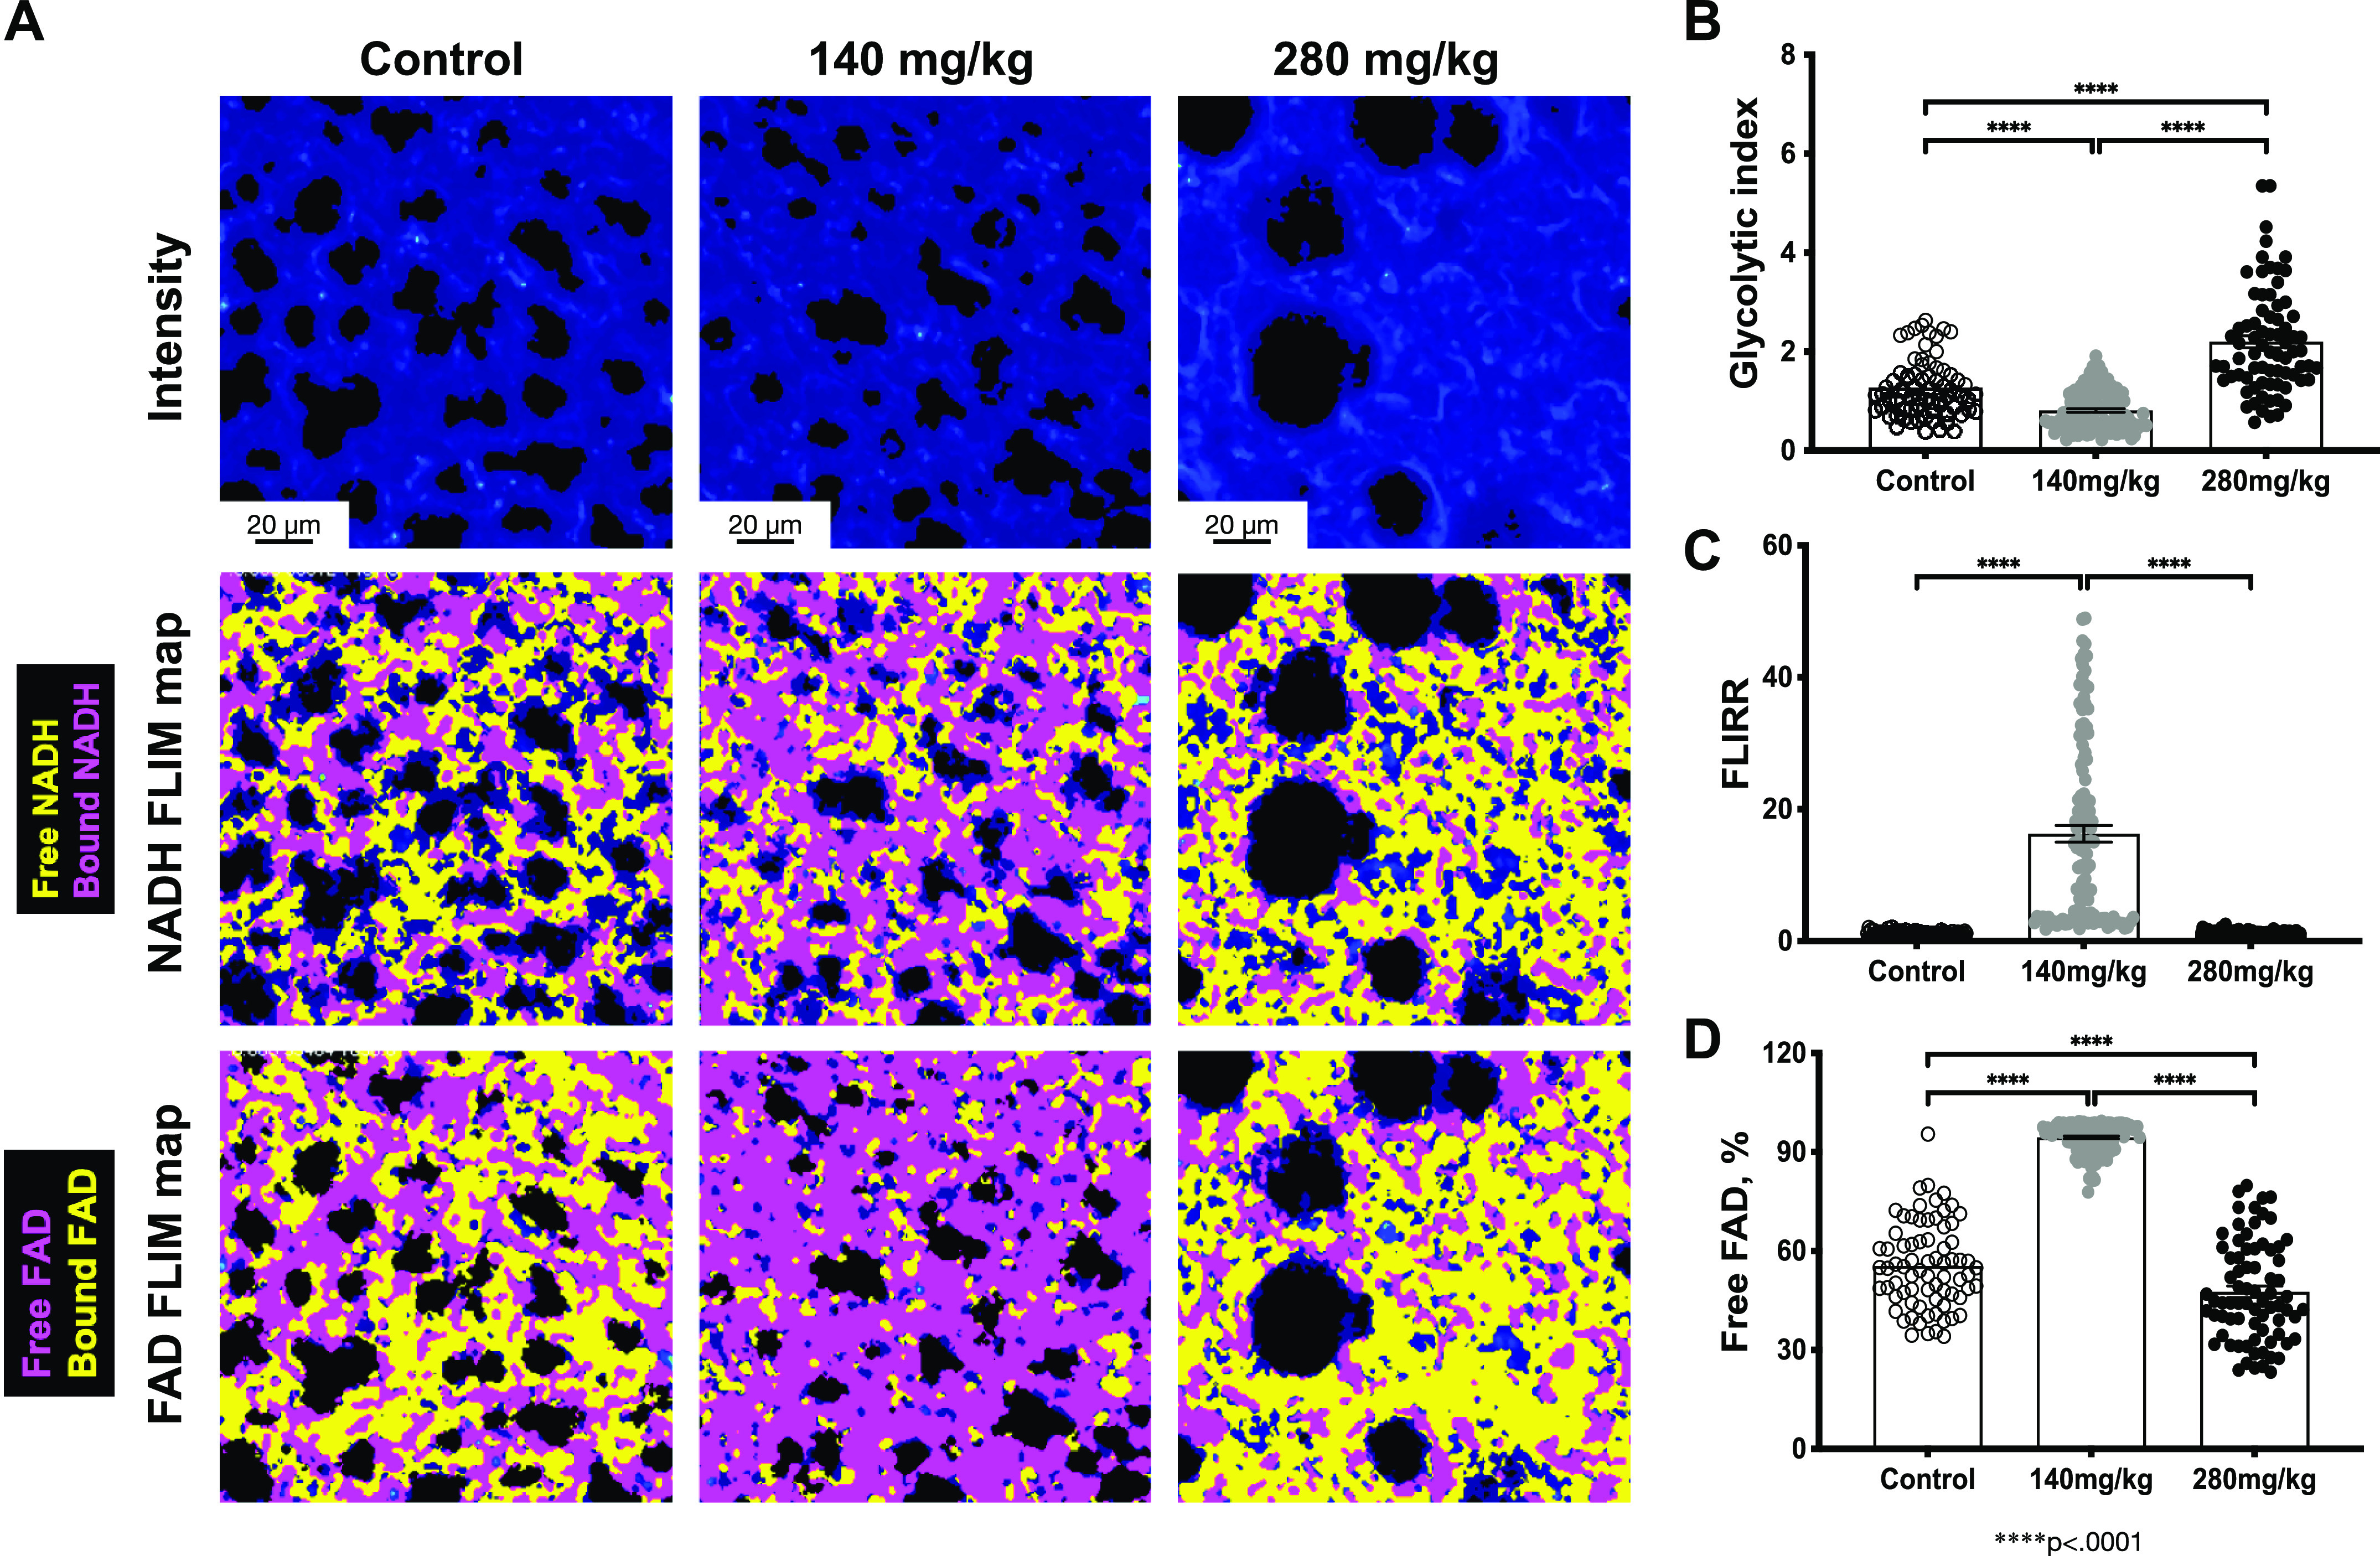
Figure 6.

Pulmonary metabolic changes following exposure to APAP exposure (140 mg/kg or 280 mg/kg, ip; 24 h). A: representative intensity images (top), NADH (middle), and FAD (bottom) Fluorescent Lifetime Imaging Microscopy (FLIM) maps for control and APAP-treated tissues are shown. Quantified (B) Glycolytic index, (C) Fluorescent Lifetime Imaging Redox Ratio (FLIRR), and (D) free FAD fraction. Data are expressed as means ± SE (250 FOVs for each condition were measured in control (n = 5 animals), APAP (140 mg/kg, ip; n = 5 animals), and APAP (280 mg/kg, ip; n = 5 animals), respectively). ****P < 0.0001. Scale bar = 20 µm. APAP, acetaminophen; FAD, flavin adenine dinucleotide; FOVs, fields of view; NADH, nicotinamide adenine dinucleotide.
