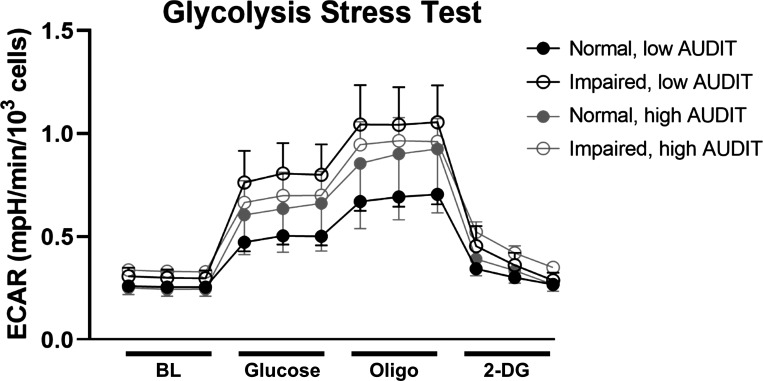
Figure 2.
Glycolysis Stress Test. Note: Extracellular acidification rate (ECAR) normalized to cell count at baseline (BL; measurements 1–3) and after the sequential addition of glucose (measurements 4–6), oligomycin (Oligo; measurements 7–9), and 2-deoxyglucose (2-DG; measurements 10–12) in myoblasts from participants with normal or impaired glucose tolerance and low (<5) or high (≥5) Alcohol Use Disorders Identification Test (AUDIT) scores. n = 35 participants, means ± SE.

