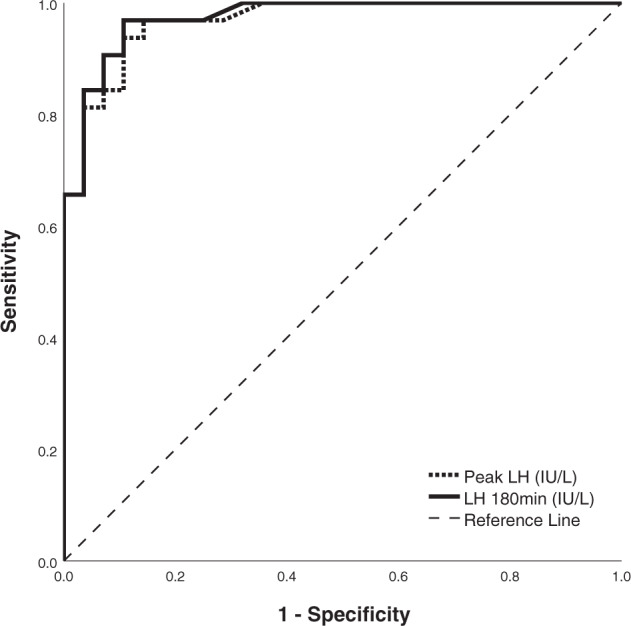
Fig. 3.

Receiver operating characteristic (ROC) curve analysis of triptorelin-stimulated LH concentrations in diagnosing CPP as determined by the GnRH test findings. Solid line illustrates high AUC of 180 min LH concentration compared with the AUC when peak LH is used from all sampling times after triptorelin injection (dotted line)
