
Figure 3. Server Performance.
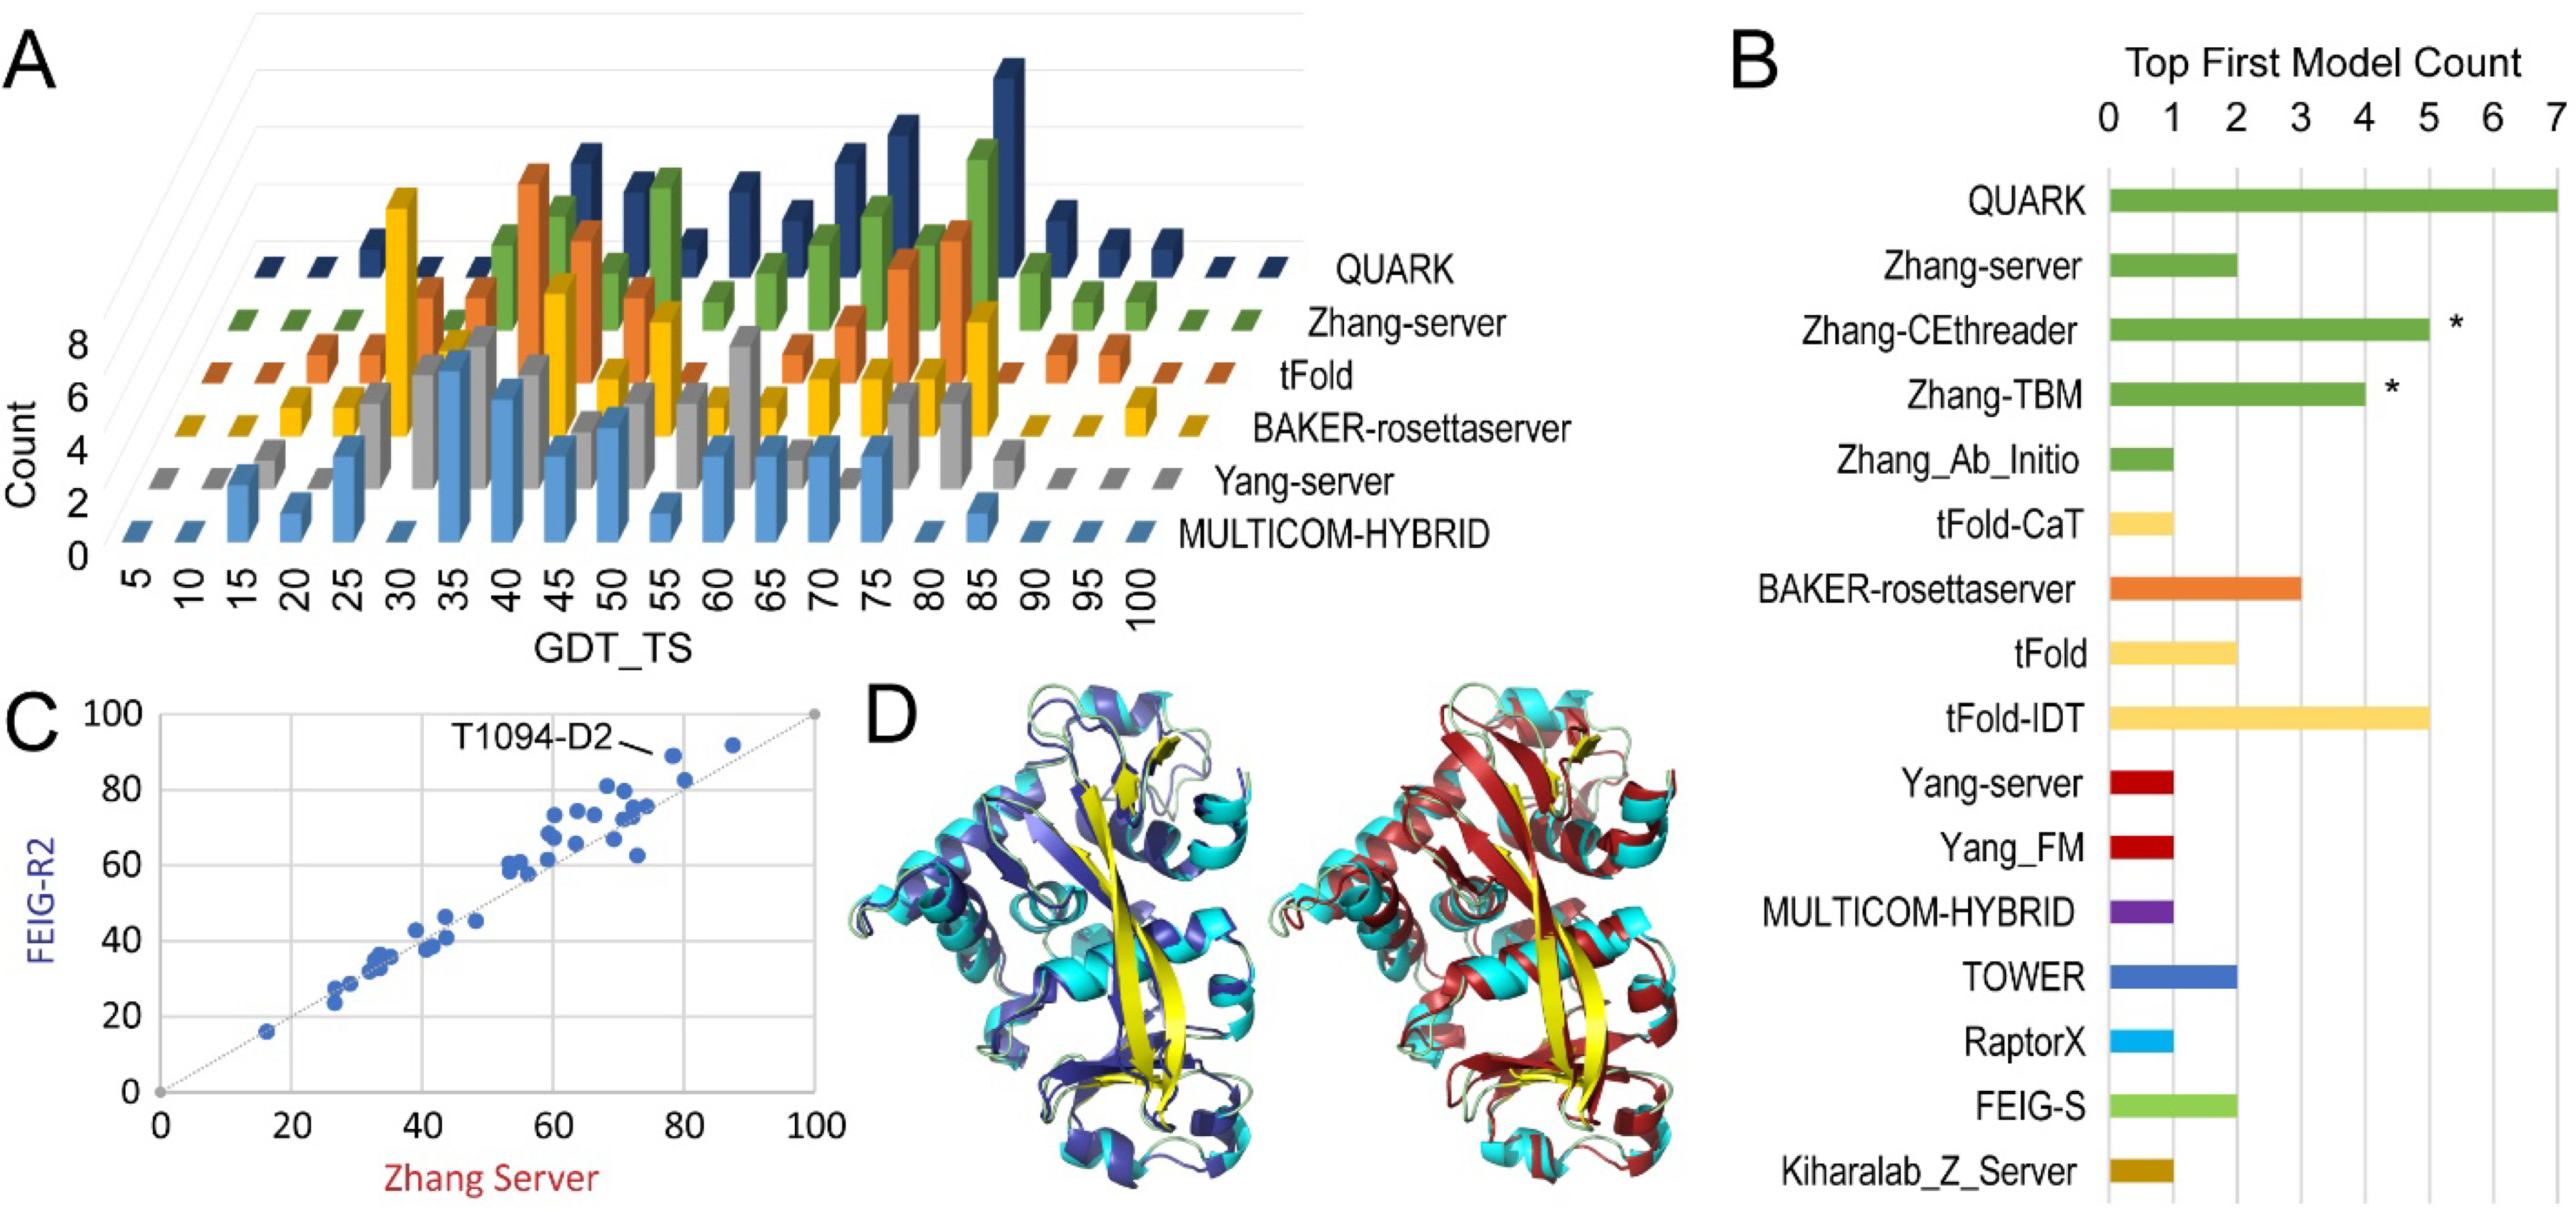
A) Histogram of GDT_TS scores (X-axis) across first models for all FM and FM/TBM target EUs for each server (Z-axis, labeled on the right). B) Bar graph represents count of top first models among server predictions for all FM and FM/TBM target EUs. Bars are colored according to independent predictor groups, who could register multiple methods and an asterisk ‘*’ marks a pair of models tied for first. C) GDT_TS score of Zhang-server models (X-axis) above GDT_TS 50 were improved by FEIG-R2 (Y-axis) refinement. An example target EU with improved model quality is labeled. D) T1094-D2 is colored according to the SSE: strand (yellow) and helix (cyan) and superimposed with the FEIG-R2 model in blue (left panel) or with Zhang-server model in red (right panel).