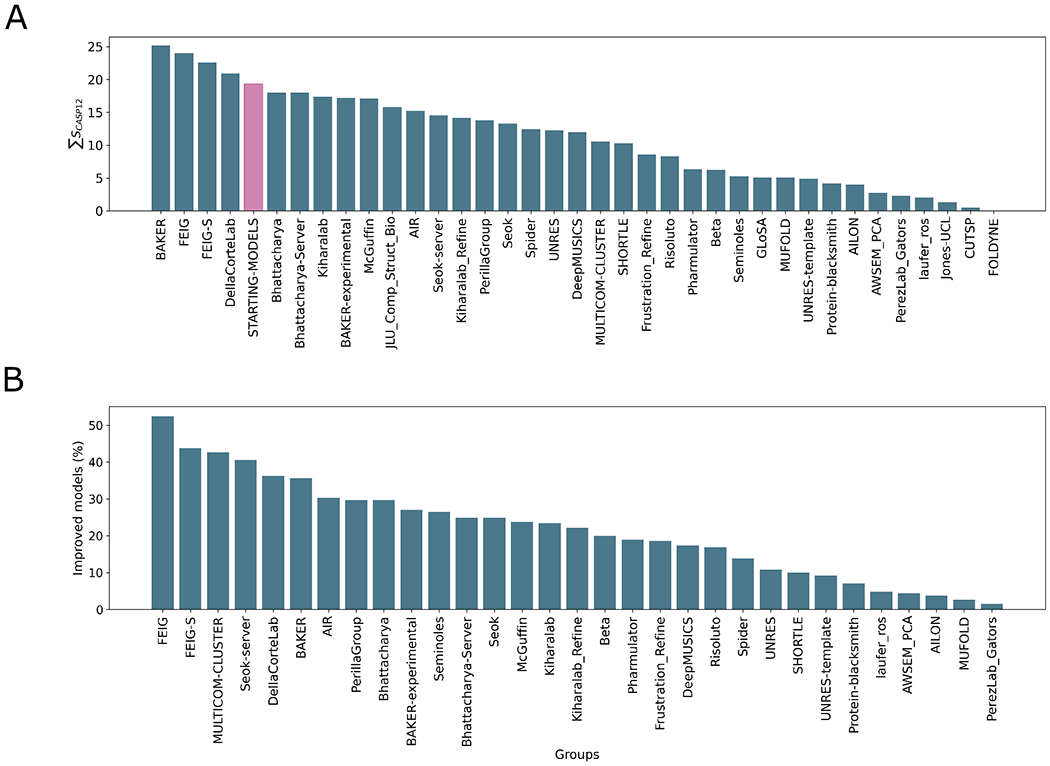
Figure 2.

Overall group ranking according to the ΣSCASP12 score (A) and proportion of models improved by each group (B). The “naïve predictor” corresponding to resubmission of the starting models is shown in pink in A. The data used to generate these figures are from the regular refinement targets i.e. excluding the extended targets but including the double-barrelled targets.
