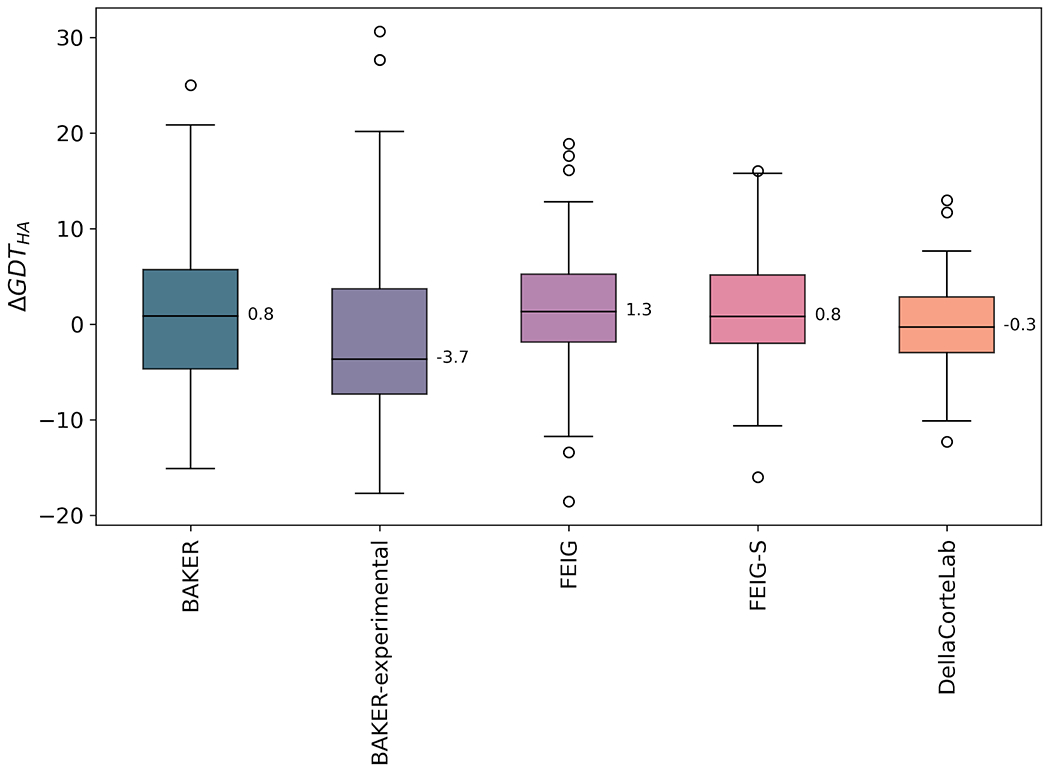
Figure 7.

Distribution of ΔGDT_HA values represented as a box and whisker plot for named groups. Box limits indicate upper and higher quartiles, whiskers indicate upper and lower bounds, circles represent outliers and a horizontal line in the middle of the box represents the median, also labelled. The data used to generate these figures are from the regular and extended targets.
