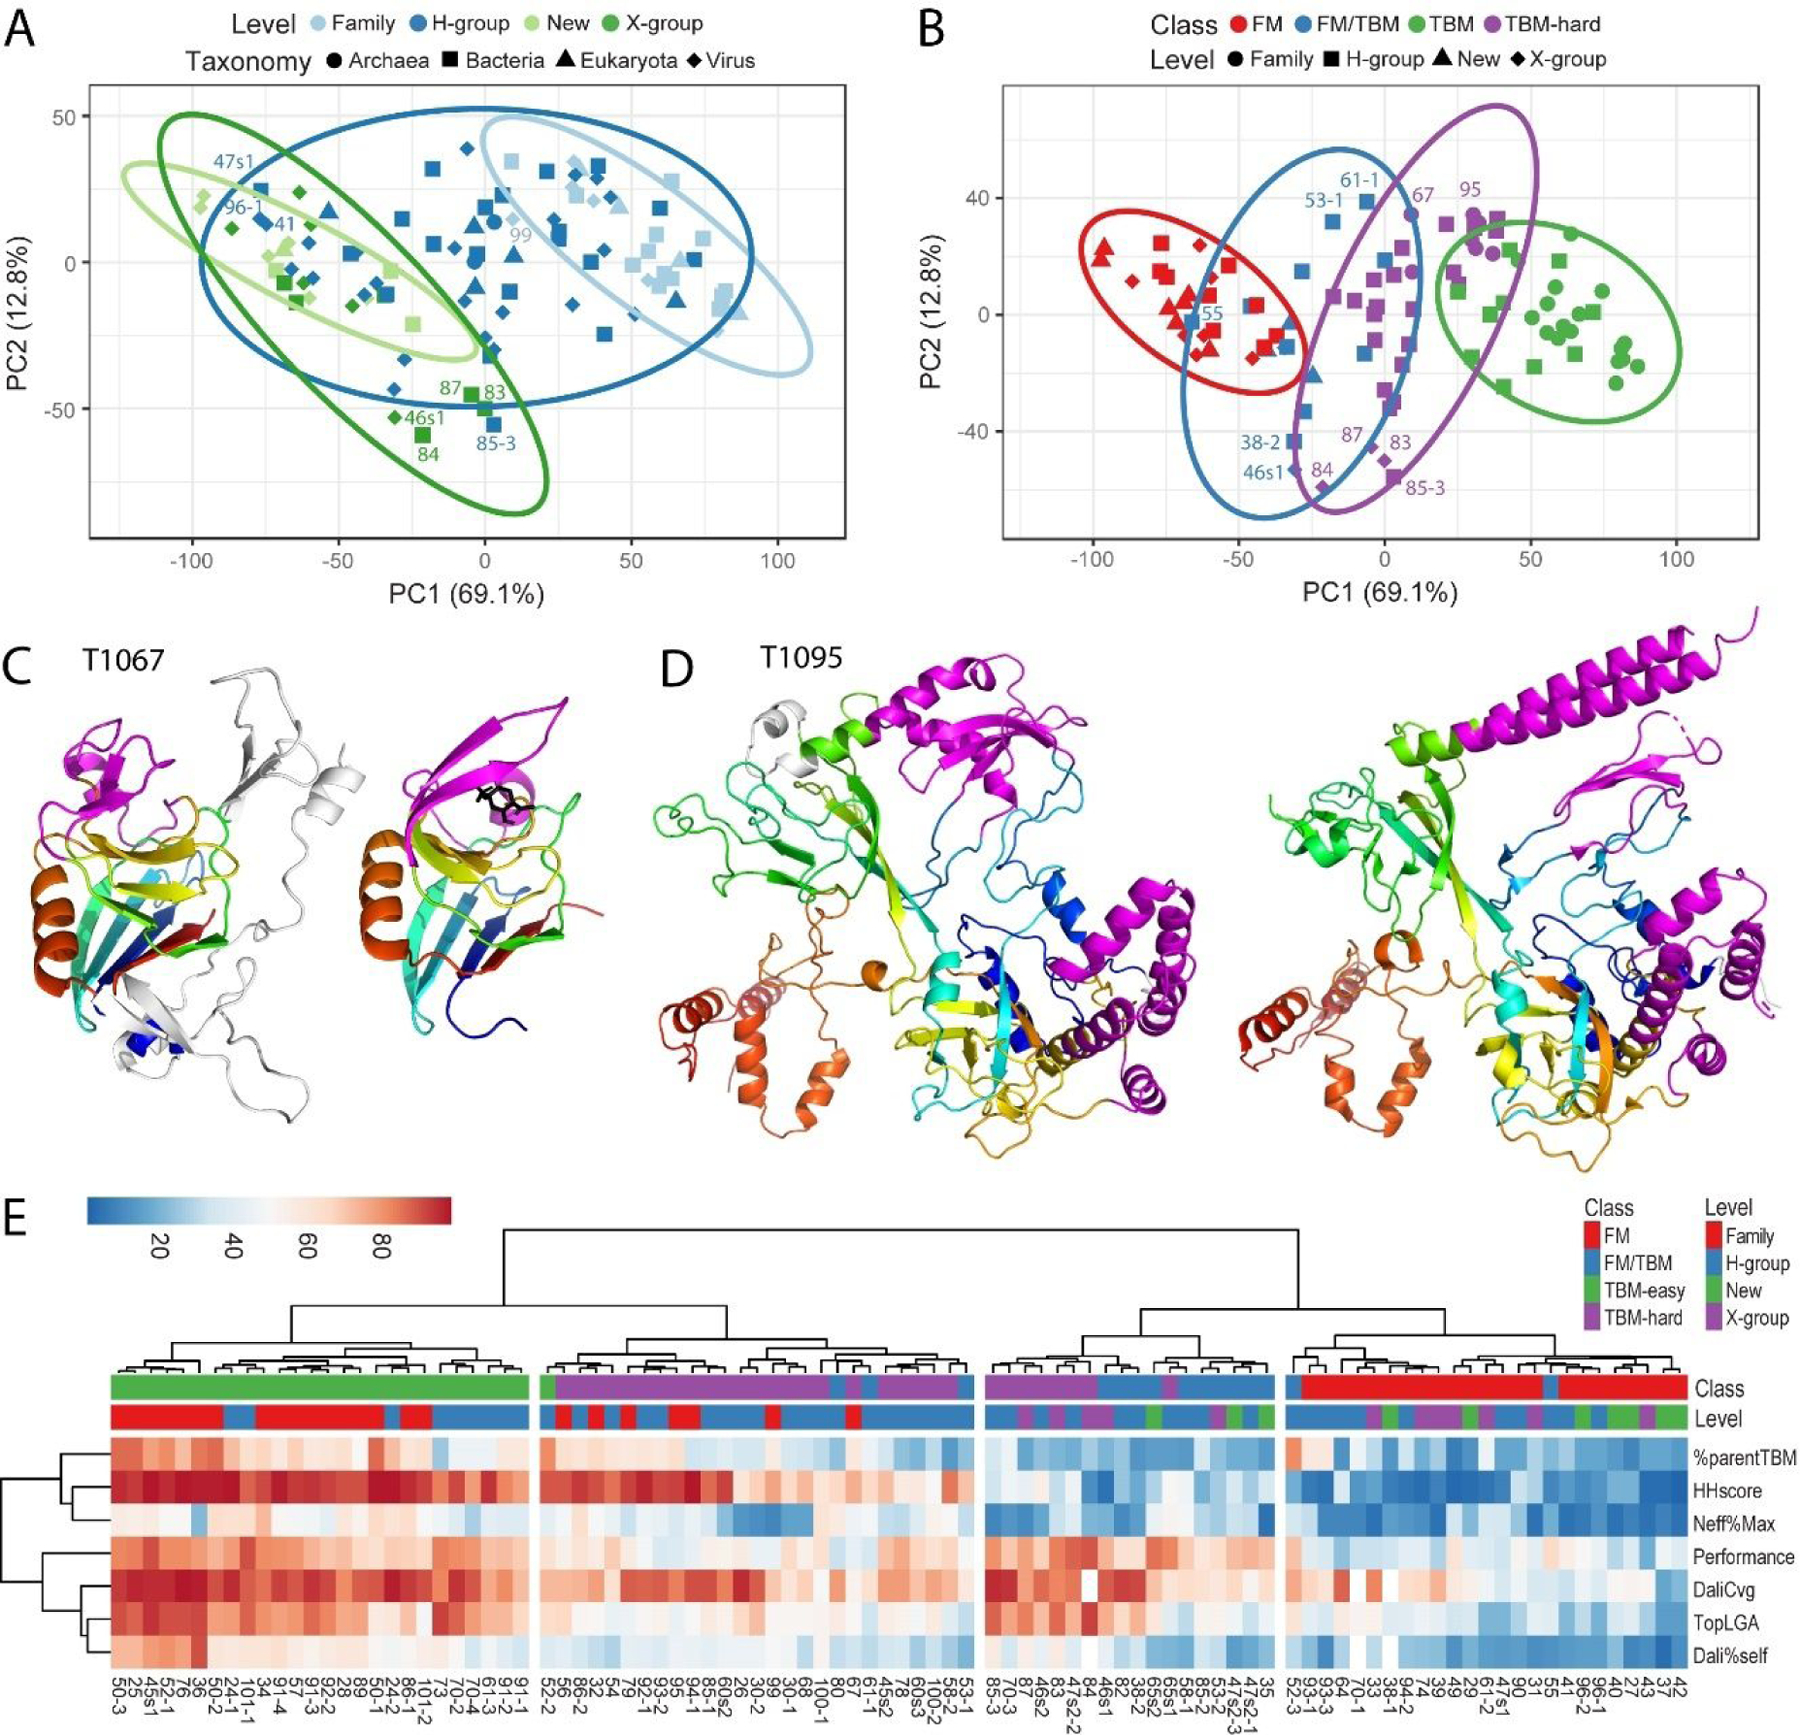
Figure 3. Target Feature Clustering Informs Classification.

A) PCA clusters of ECOD classification level: Family (light blue), H-group (blue), X-group (green), and New (light green); symbols represent taxonomy: Archaea (circle), Bacteria (square), Eukaryota (triangle) and Virus (diamond) are based on seven scores: sequence relationship to template (HHscore), predictor declaration of parent template (%parentTBM), effective sequences (Neff%Max), performance of top 20 servers (performance), and structure relationship to template using LGA_S (TopLGA), DaliLite Z-scores (Dali%self), and DaliLite coverage (DaliCvg). Ellipses represent 95% confidence level. Some targets discussed in the text are labeled, omitting “T10” or “T1” prefix for brevity. B) PCA clusters of tertiary structure prediction class: TBM-easy (green), TBM-hard (purple), FM/TBM (blue), and FM (red); symbols represent level: Family (circle), H-group (square), X-group (diamond) and New (triangle) use the same scores and are labeled similarly. C) YkuD-like superfamily member T1067 (left) has insertions (white) with respect to the core fold (rainbow) present in the YkuD-like template (PDB: 6fj1C, right). Each have modifications (magenta) surrounding the presumed active site (black stick, right). D) Four domain target T1095 (left) with a single EU has alternate conformations of SSEs (magenta) with respect to the sequence-related template (PDB: 6j9fC, right) with the same fold (rainbow cartoon). E) Heatmap depicts score range (0–100) using a diverging color scheme from blue to red. Scores (rows) are clustered using correlation distance and Ward linkage and Target EUs (columns) are clustered using Euclidean distance and Ward linkage. Target EU features of ECOD level and tertiary prediction class are colored in the columns above the heatmap according to the legend.
