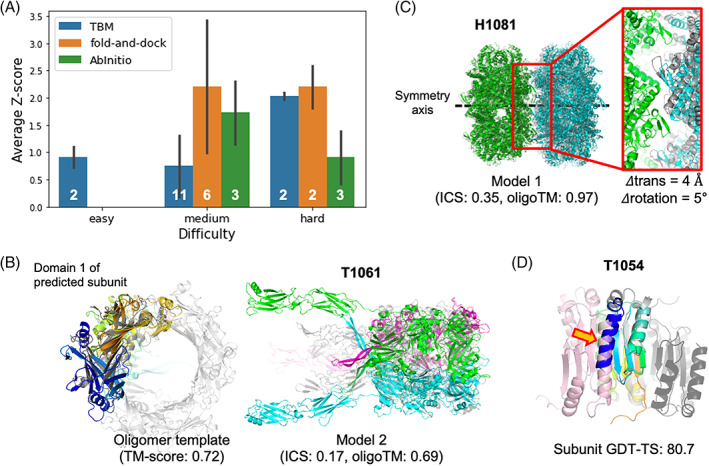
FIGURE 4.

Oligomer modeling performance of BAKER‐experimental group. (A) The relative performance in terms of average Z‐score for the best out of five submissions for each target difficulty and modeling strategy we used. (B) A successful example (T1061) of template‐based approach by detecting a distant oligomer template based on structural similarity. Left; The subunit structure (colored in rainbow) used to search oligomer templates and the detected template (colored in gray, PDB ID: 3CDD) are shown. Right; The predicted structure (submitted as model 2) is shown with the native structure colored in gray. (C) A successful example (H1081) of ab initio docking with a constraint to match symmetry axes of two subunits. The native structure is colored in gray. (D) A failed example (T1054) to generate a correct binding pose by ab initio docking with the subunit structure (colored in rainbow colors from the N‐terminus in blue to the C‐terminus in red) having high GDT‐TS. The problematic N‐terminal helix is highlighted by an orange arrow. The correct binding pose is colored in pink while the predicted one is colored in dark gray
