
Figure 5: Global landscape of the interface prediction performance.
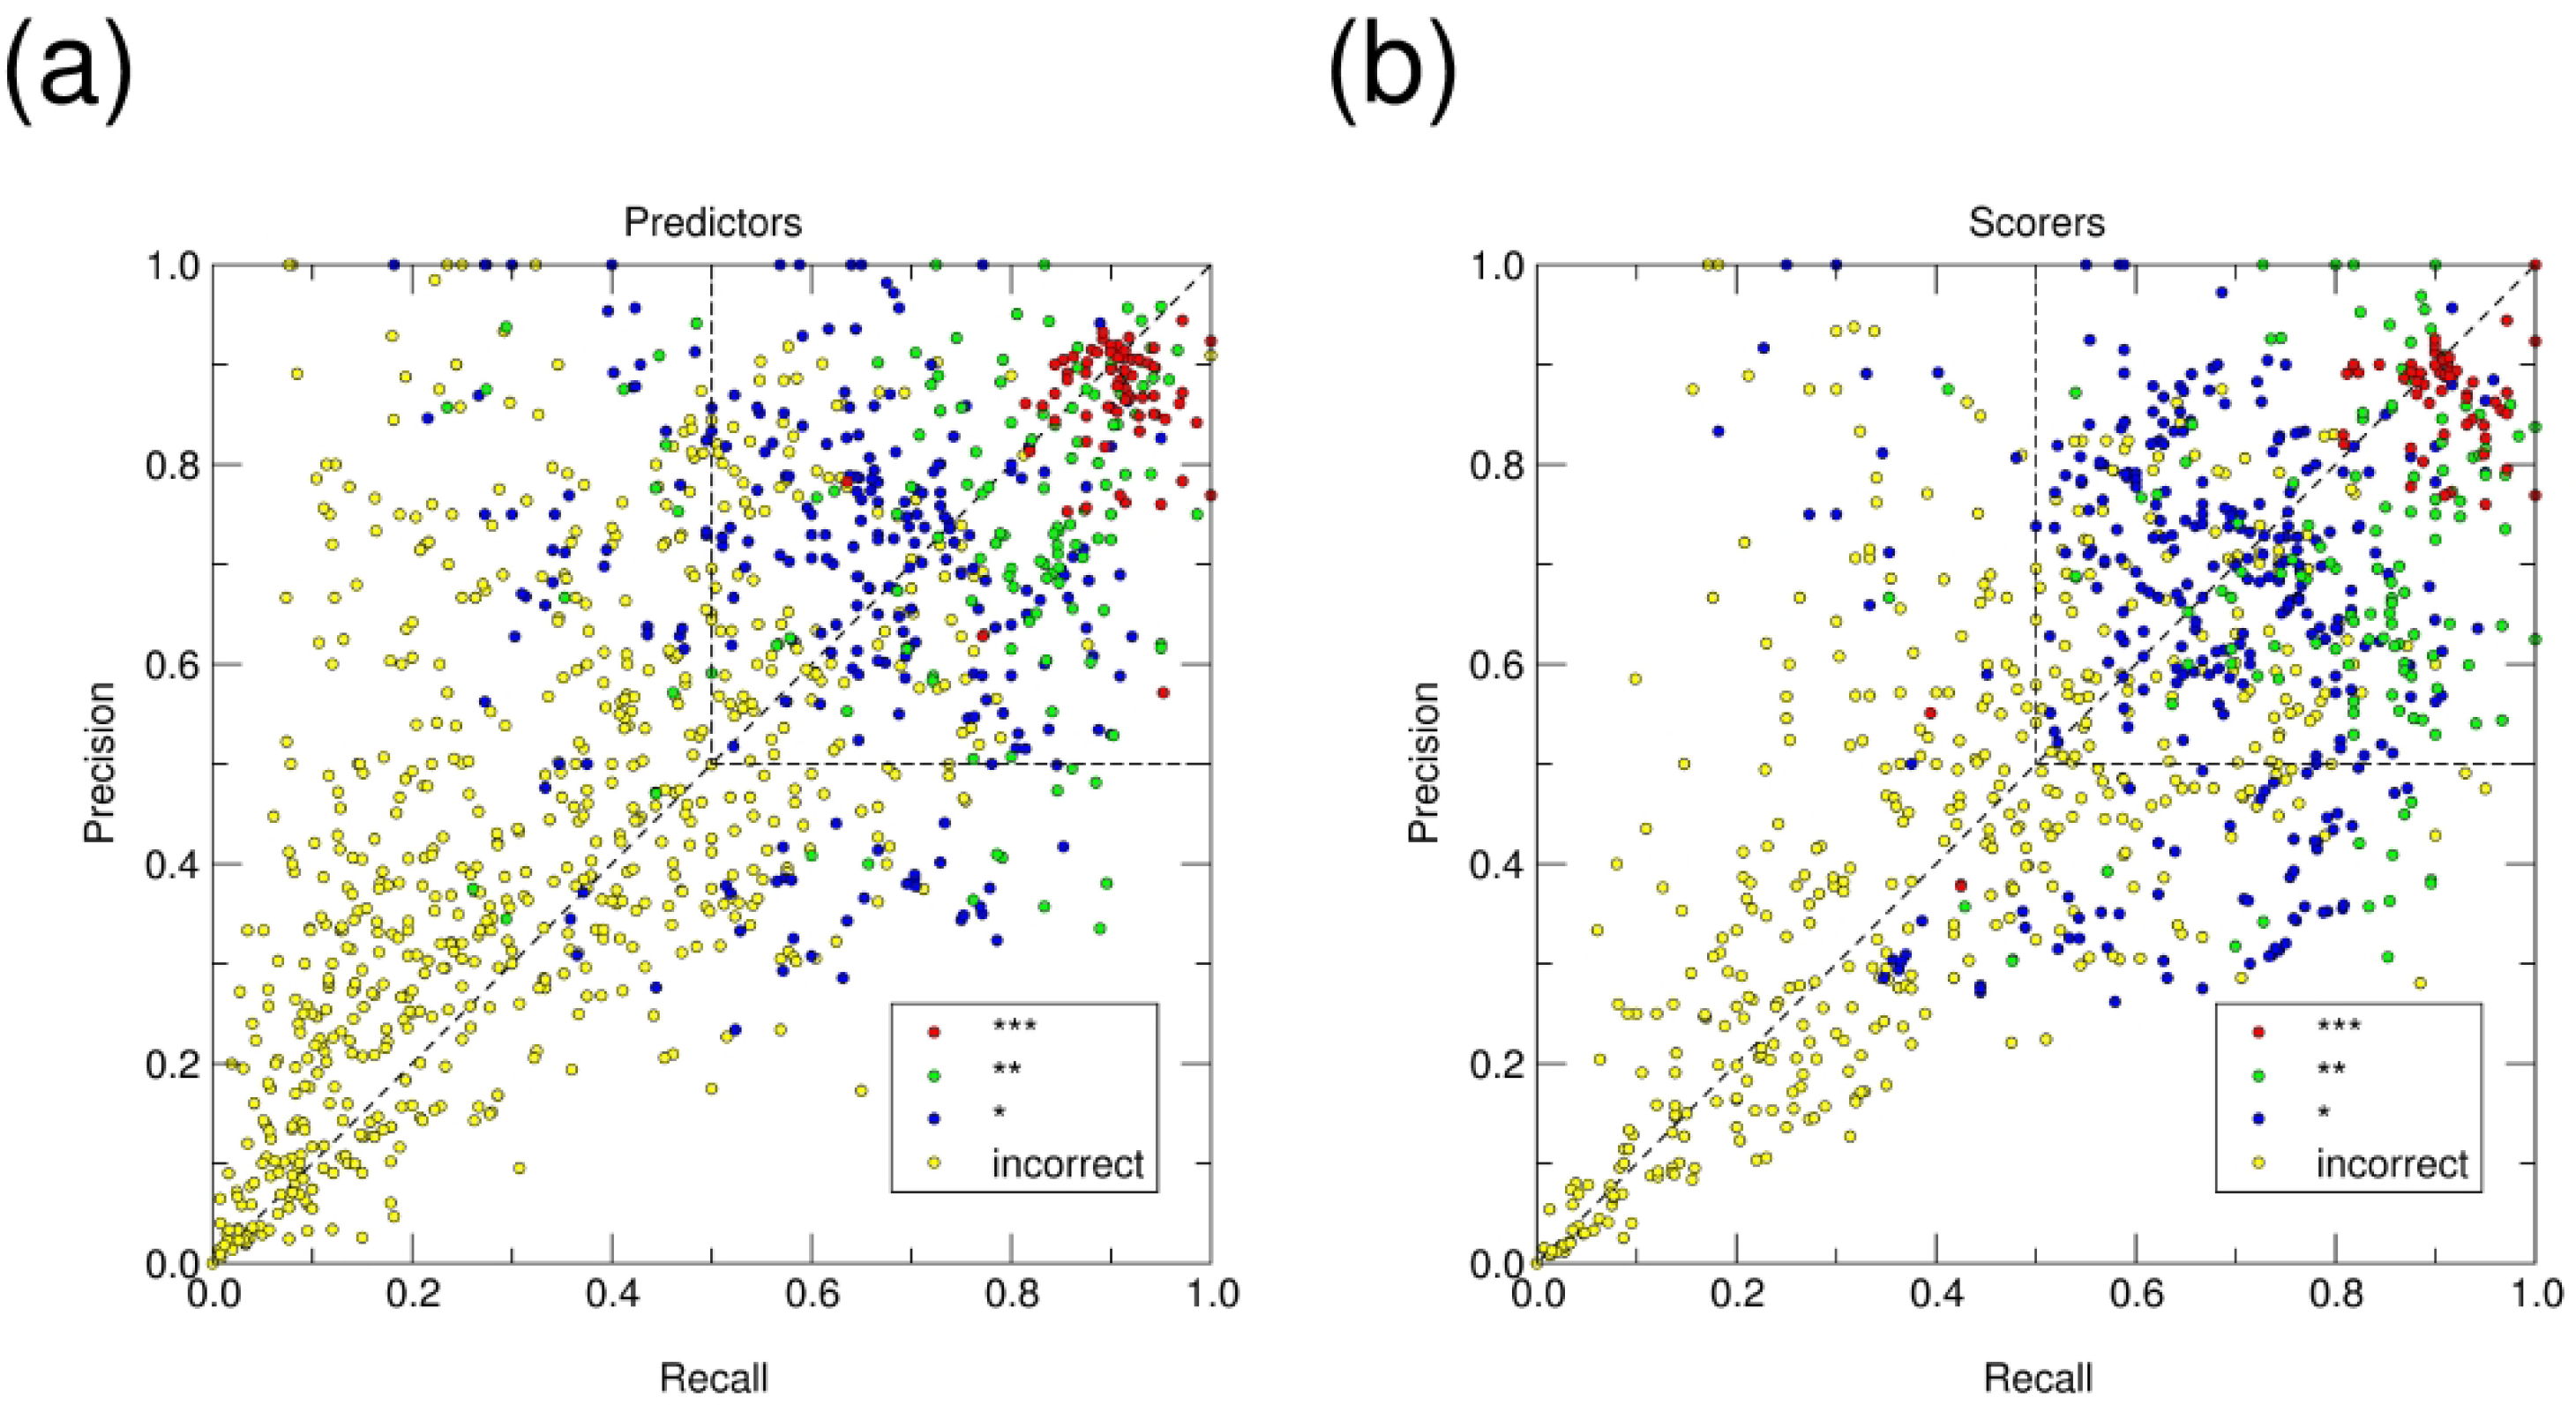
Scatter plot showing the average Recall and Precision values (see main text for definition) of the interfaces in models submitted by all predictors (a) and scorers (b) for the 12 targets of Round 50. Each point represents the average Recall and Precision values for the interfaces of the individual protein components (i.e. the receptor and ligand proteins, respectively) in the 5 models submitted by each participant for one binary association mode. Averaging was performed separately over models in the 4 CAPRI accuracy categories (incorrect, acceptable, medium, and high). For example, for a participant submitting 5 models or which 2 were incorrect, 2 of medium quality and 1 of high quality, average Recall and Precision values were computed for the 2 incorrect models, and the 2 medium-quality ones, respectively, whereas those for the single high-quality models were used as such. Individual points are color-coded by the CAPRI model quality category (as indicated in the legend displayed in the upper left corner of each graph). The upper right-hand quadrant of the graph, with Recall and Precision values above 0.5, contains all points corresponding to “correct” interface predictions.
The 2 salient outlier green points in (a) correspond to the medium accuracy models with high f(non-nat) values submitted by Kozakov/CLUSPRO for the T170.5 interface. The 2 salient outlier red points in (b), correspond to the high accuracy models with however high f(non-nat) values submitted by the group of Zou for the T177.2 interface.