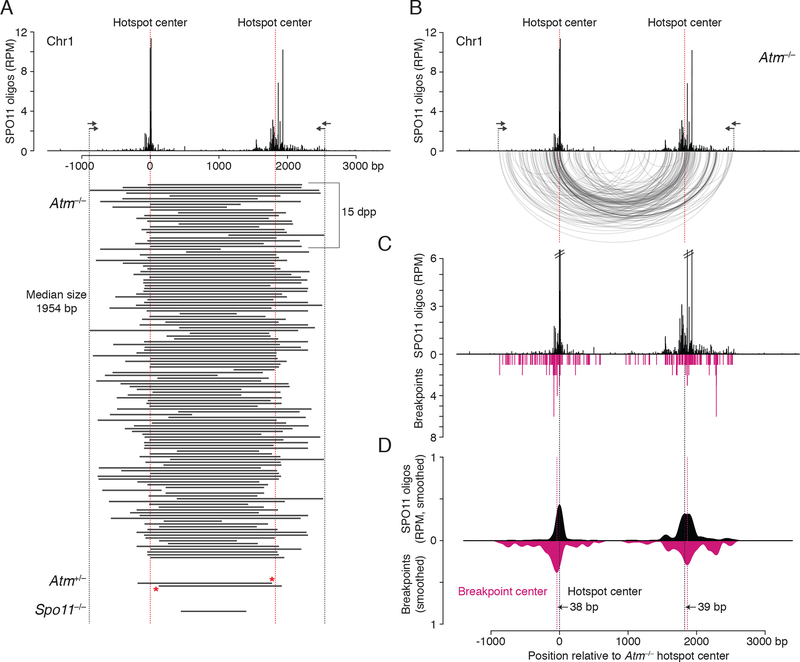
Figure 2. Deletion breakpoints at the Chr1 hotspot pair.
(A) Deleted DNA sequences at the Chr1 hotspot pair. Deletions (black bars) were combined from adult and juvenile testes (dpp, days post partum). Red asterisks indicate breakpoints in Atm+/− shared with Atm−/−.
(B) Arc diagram of deletions in Atm−/− at the Chr1 hotspot pair. Arcs link the breakpoints of each deletion (134 deletions total). Both deletion breakpoints often map close to the hotspot centers. See also Figure S3A and S3B.
(C) Individual breakpoints cluster around the hotspot centers but are also observed to spread.
(D) Smoothed breakpoint and SPO11-oligo profiles display similar shapes (201-bp Hann filter for smoothing). Offsets between centers of hotspots and breakpoint distributions are indicated.

