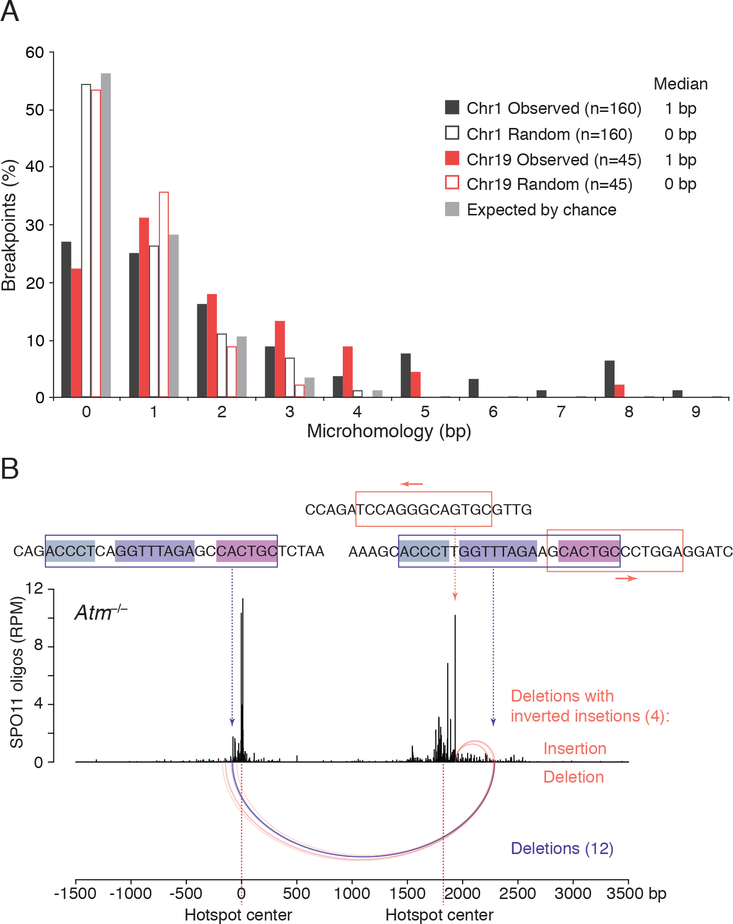
Figure 5. Microhomology at deletion breakpoints in Atm−/−.
(A) Distribution of microhomology lengths observed at the deletion breakpoints for Chr1 and Chr19 hotspot pairs. Microhomology expected by chance was calculated as previously described assuming an unbiased DNA sequence composition (Roth et al., 1985). “Random” indicates microhomology at junctions artificially generated by shifting the original, “Observed” breakpoints by 10 bp outward; this randomization controls for local biases in DNA sequence composition. See STAR Methods for details. Only deletions without insertions or other DNA-end modifications are included (Table S2).
(B) Recurrent deletion within the Chr1 hotspot pair at an imperfect repeat. Twelve simple deletions in Atm−/− map to this repeat at one of the three internal identical repeats of 5, 8, and 6 bp (violet arcs). Four other deletions with inverted insertions also involve this imperfect repeat as well as a 13-bp inverted microhomology at the hotspot center, with the insertions indicated above the deletions (orange arcs). See also Table S4 and Figure S6E.

