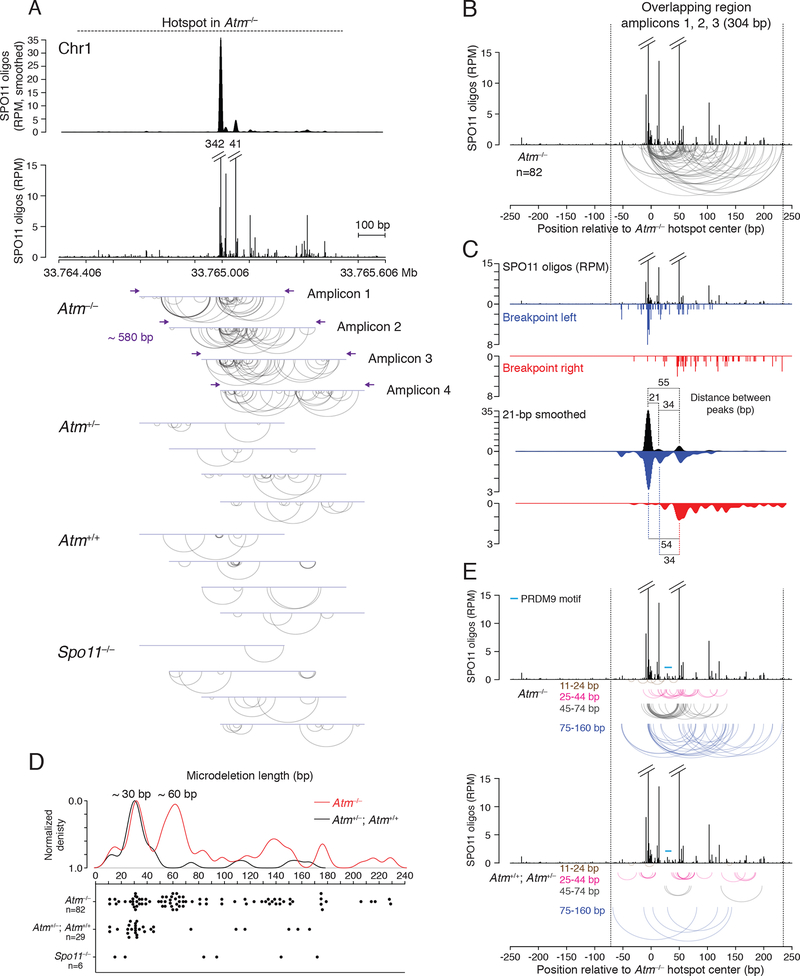
Figure 7. Microdeletions within a single DSB hotspot.
(A) Detection of microdeletions at a strong DSB hotspot on Chr1 using amplicon deep sequencing. The hotspot displays a major SPO11-oligo peak, a secondary peak, and several minor peaks, as shown in the smoothed (21-bp Hann filter) and unsmoothed profiles. Four overlapping amplicons were deep sequenced to identify microdeletions. Arc diagrams of independent microdeletions found in each amplicon for the indicated genotypes are shown. For microdeletion frequencies, see Table S7.
(B, C) Microdeletions from Atm−/− in the region overlapping in amplicons 1, 2, and 3. B, Arc diagram of independent microdeletions. C, Distributions of the left and right breakpoints relative to the SPO11-oligo distribution. Both unsmoothed and smoothed profiles are shown.
(D, E) Microdeletion length distributions in the overlapping region. D, Density and scatter plots of microdeletion lengths (>10 bp). E, Arc diagrams of microdeletions stratified by length. Microdeletions >160 bp are not shown, as their location may be more restricted by the size of the assessed region. See also Figures S7E and S7F for larger microdeletion distribution.

