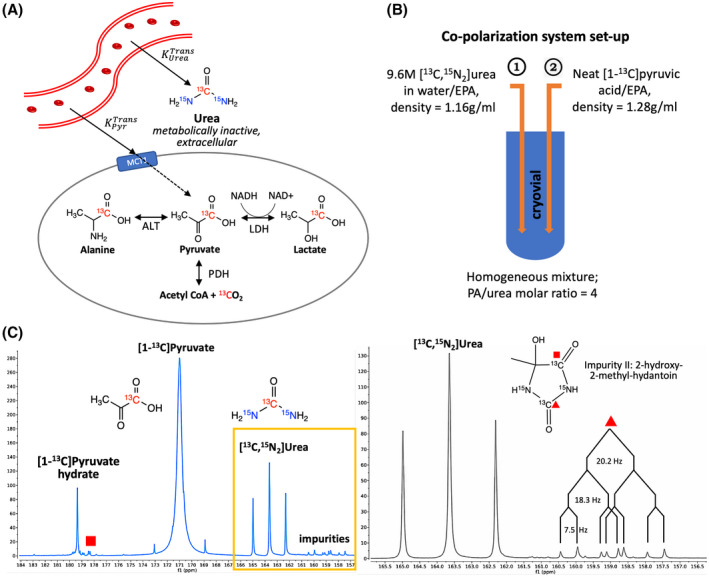
FIGURE 1.

A, Imaging mechanism: hyperpolarized [13C]pyruvate and urea are intravenously administered in a single bolus, then leave the vasculature and enter the exocellular space (indicated by the solid line). Pyruvate can enter the cell at a slower rate compared to the vascular delivery (indicated by the dashed line) and be metabolized into lactate, alanine, or CO2/bicarbonate, evaluating multiple metabolic fluxes. In contrast, urea is predominately extracellular and metabolically inactive, serving as a perfusion sensing probe. (Ktrans, vascular transfer constant; MCT, monocarboxylate transporter; LDH, lactate dehydrogenase; ALT, alanine transaminase; PDH, pyruvate dehydrogenase). B, Co‐polarization system set up: urea/water/EPA mixture (lower density) is loaded into cryovial first, then PA/EPA mixture is added (higher density), resulting in a homogeneous mixture of PA and urea with a molar ratio of 4:1 (PA, pyruvic acid; EPA, electron paramagmetic agent). C, Representative 13C NMR spectra of hyperpolarized [1‐13C]pyruvate and [13C, 15N2]urea. The right spectrum zooms in the boxed region of the left spectrum, showing urea and Impurity II with relevant coupling constants (J CN = 20.2 Hz, J CN = 18.3 Hz, J CC = 7.5 Hz)
