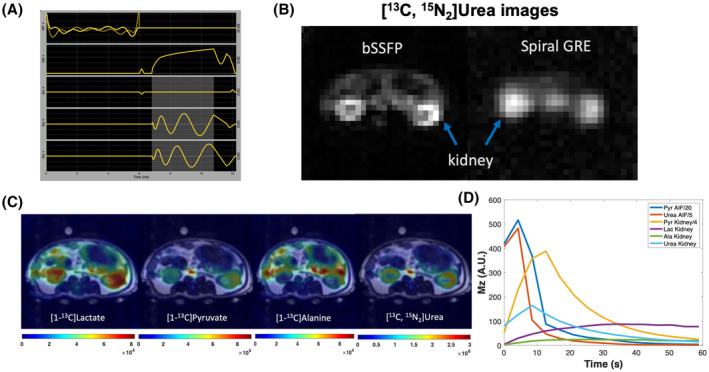
FIGURE 4.

A, A pulse sequence diagram of bSSFP sequence for HP 13C urea acquisition (highlighted area indicates readout duration). B, bSSFP sequence produced superior image quality (signal‐to‐noise ratio, resolution, sharpness) compared to the single‐shot spiral GRE sequence. C, Representative simultaneously acquired metabolism and perfusion images of an adult rat: sum HP signals of each metabolite were overlaid on T2 weighted images; flip angels of lactate, alanine, pyruvate, and urea were 30°, 30°, 8°, 50°, with 2.5 × 2.5 × 21 mm spatial resolution and 4.2 s temporal resolution. D, HP signal dynamics in the aorta and kidneys of an adult rat
