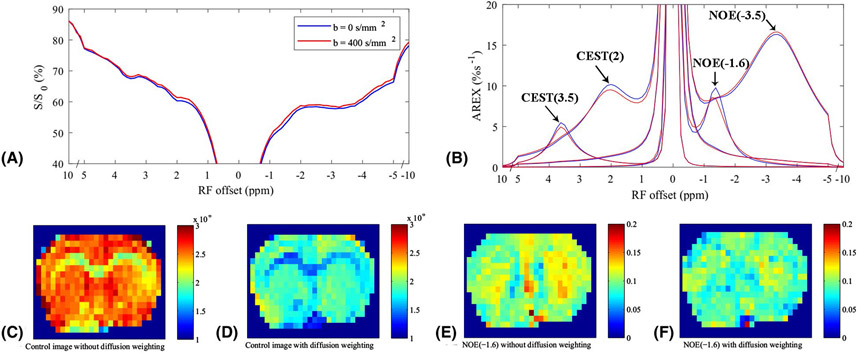
Figure 1.
Average CEST Z-spectra (a) and AREX spectra (b) for each pool from the whole brain of 5 rat brains with a diffusion-weighting of b = 0 s/mm2 (blue) and 400 s/mm2 (red), respectively. Control images without (c) and with (d) the diffusion weighting, respectively, from a representative rat brain. NOE(−1.6) images without (e) and with (f) the diffusion weighting, respectively, from a representative rat brain.

