FIGURE 7.

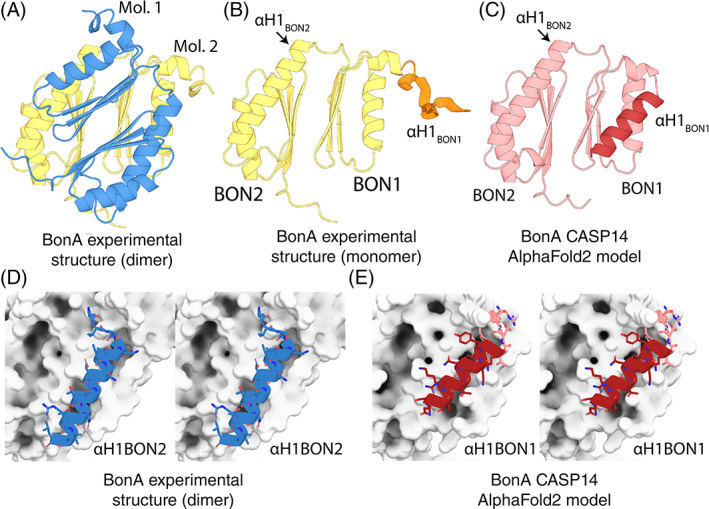
Comparison of the BonA experimental structure and CASP14 model. (A) The X‐ray crystal structure of BonA‐27N, showing the symmetrical dimer observed in the crystal structure. (B) One molecule of the BonA‐27N dimer shown in Panel A, with α‐helix 1 of BON1 (αH1 of BON1), which is disordered in the crystal structure, modeled as an unstructured polypeptide in orange. (C) The CASP14 AlphaFold2 model of BonA, with αH1 BON1 that adopts a canonical BON‐domain fold highlighted in dark red. (D) A cross‐eye stereo view of the interaction between αH1 of BON2 of one molecule of the BonA dimer (shown as a blue cartoon), with its dimer partner (shown as a white surface) in the experimentally determined structure. (E) A cross‐eye stereo view of the interaction between αH1 of BON1 (shown as a red cartoon) and the remainder of the monomeric BonA AlphaFold2 model, showing the αH1 of BON1 adopts an analogous conformation to that of αH1 of BON2 in the experimental structure
