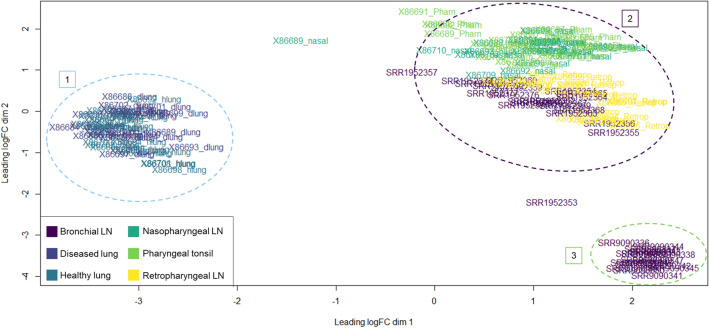
Figure 1.
MDS plot of 151 datasets utilized for ML classification. Clustering was performed with Euclidian distances across the top 500 genes based on log2 standard deviation. Datasets are demarked by color, representing the tissue site of sampling. Labels 1, 2, and 3 demark distinct gene expression clusters across tissue types, regardless of etiological component, based on expressional variation. Label 1 consists of healthy (non-consolidated) and diseased (consolidated) lung tissue. Label 2 consists of lymphoid tissue from Tizioto and colleagues30 and Behura and colleagues31. Label 3 consists of lymphoid (bronchial) tissue from Johnston and colleagues32.

