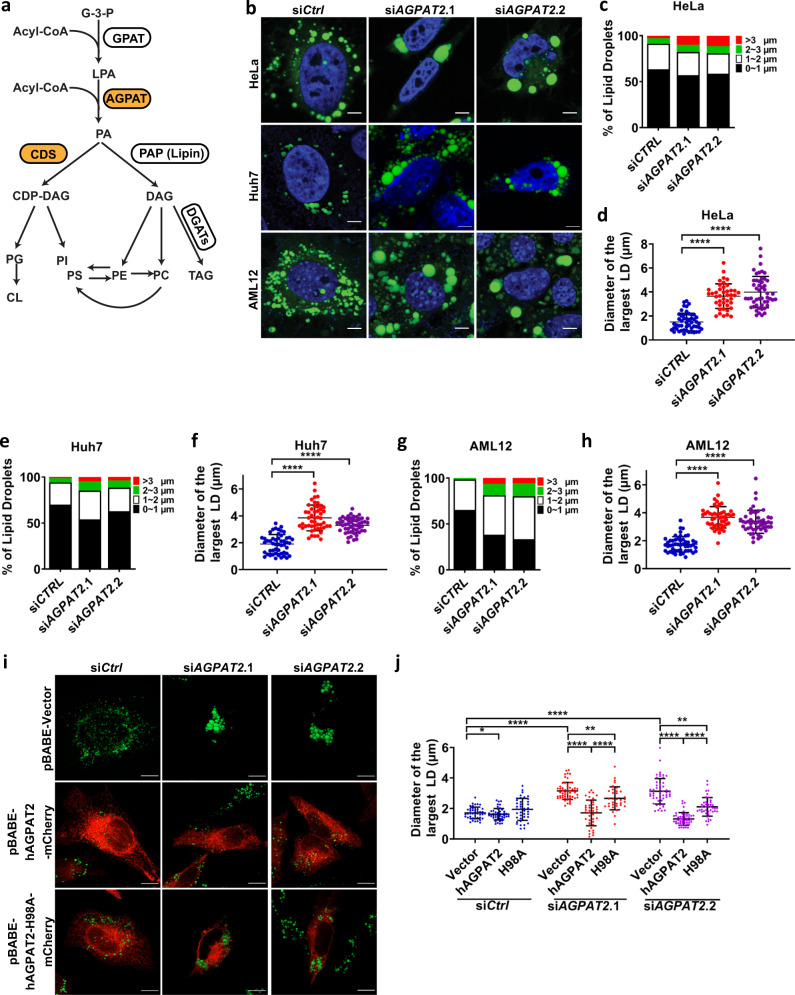
Fig. 1. AGPAT2 depletion alters LD morphology.
a The glycerol-3-phosphate (G-3-P) pathway for the synthesis of phospholipids and triacylglycerols. GPAT glycerol-3-phosphate O-acyltransferase, AGPAT 1-acylglycerol-3-phosphate O-acyltransferase, LPA lysophosphatidic acid, PA phosphatidic acid, PAP PA phosphatase, CDS CDP-DAG synthase, DAG diacylglycerol, PS phosphatidylserine, PE phosphatidylethanolamine, PC phosphatidylcholine, TAG triacylglycerol, PG phosphatidylglycerol, PI phosphatidylinositol, CL cardiolipin. b Confocal imaging of LDs in control and HeLa, Huh7 and AML12 cells treated with AGPAT2 siRNA. The cells were treated with 20 nM siRNA for 24 h, followed by oleate treatment (400 μM) for 18 h. Blue represents DAPI staining, and green represents BODIPY staining. Bars: 5 μm. c, e, g Bar graphs show LD size distribution in HeLa, Huh7 and AML12 cells. Diameter of all detectable LDs in a cell was measured and represented by red (>3 µm), green (2–3 µm), white (1–2 µm) and black (0–1 µm) (n = 42–50 cells examined over 3 biologically independent experiments). d, f, h Quantification of LD diameters in HeLa, Huh7 and AML12 cells. Diameter of the largest LD in a cell was measured (mean ± SD; ****p < 0.0001, one-way ANOVA, n = 42–50 cells examined over three biologically independent experiments). i Human AGPAT2-mCherry or the catalytic dead mutant H98A was overexpressed in AGPAT2 knockdown HeLa cells. Cells were treated with 400 μM oleic acid for 18 h. Green represents BODIPY staining and red indicates mCherry expression. Bars = 5 μm. j Quantification of LD diameters after overexpressing vector, AGPAT2-mCherry, and AGPAT2-H98A-mCherry in AGPAT2 knockdown HeLa cells. Diameter of the largest LD in a cell was measured (mean ± SD; ****p < 0.0001; **p < 0.01, two-way ANOVA, n = 31–59 cells examined over three biologically independent experiments).

