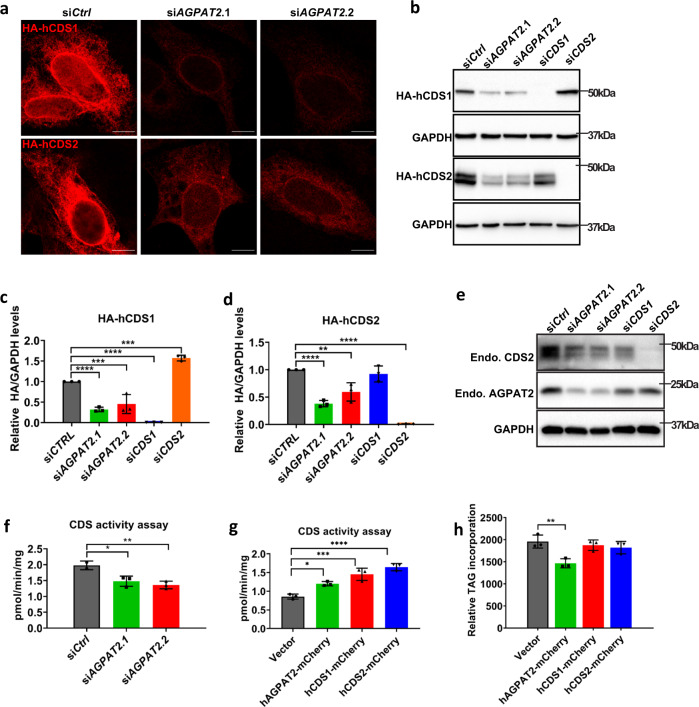
Fig. 4. Reduced CDS1/2 protein level and activity in AGPAT2-deficient cells.
a The fluorescence intensity of HA-hCDS1/2 in control and AGPAT2 knockdown Huh7 cells. Bars: 10 μm. b Immunoblot of HA-tagged CDS1 and CDS2 in control, AGPAT2, CDS1 and CDS2 knockdown Huh7 cells. c, d Quantitation of (b) (mean ± SD; one-way ANOVA ****p < 0.0001, n = 3 biologically independent experiments). e Immunoblot of endogenous CDS2 and AGPAT2 protein in control, AGPAT2 and CDS2 knockdown Huh7 cells. f CDS activity in control and AGPAT2 knockdown Huh7 cells. CDS activity assay was performed by using [3H] cytidine 5′-phosphate, egg PA and 0.05 mg membrane fractions from Huh7 transiently transfected with control or AGPAT2 siRNA. The radioactive products were measured by a scintillation counter (mean ± SD; one-way ANOVA, **p < 0.01, *p < 0.05, n = 3 biologically independent experiments). g CDS activity in HeLa cells transiently transfected with mCherry-vector, hAGPAT2-mCherry, hCDS1-mCherry or hCDS2-mCherry (mean ± SD; one-way ANOVA, ***p < 0.001, **p < 0.01, *p < 0.05, n = 3 biologically independent experiments). h TAG incorporation rate was measured by treating HeLa cells transiently transfected with mCherry-vector, hAGPAT2-mCherry, hCDS1-mCherry or hCDS2-mCherry with 1 µCi [14C] oleate for 30 min. 14C-labelled TAG was extracted, separated, and visualized by Typhoon FLA 9500 phosphor imager (mean ± SD; one-way ANOVA, **p < 0.01, n = 5 biologically independent experiments).

