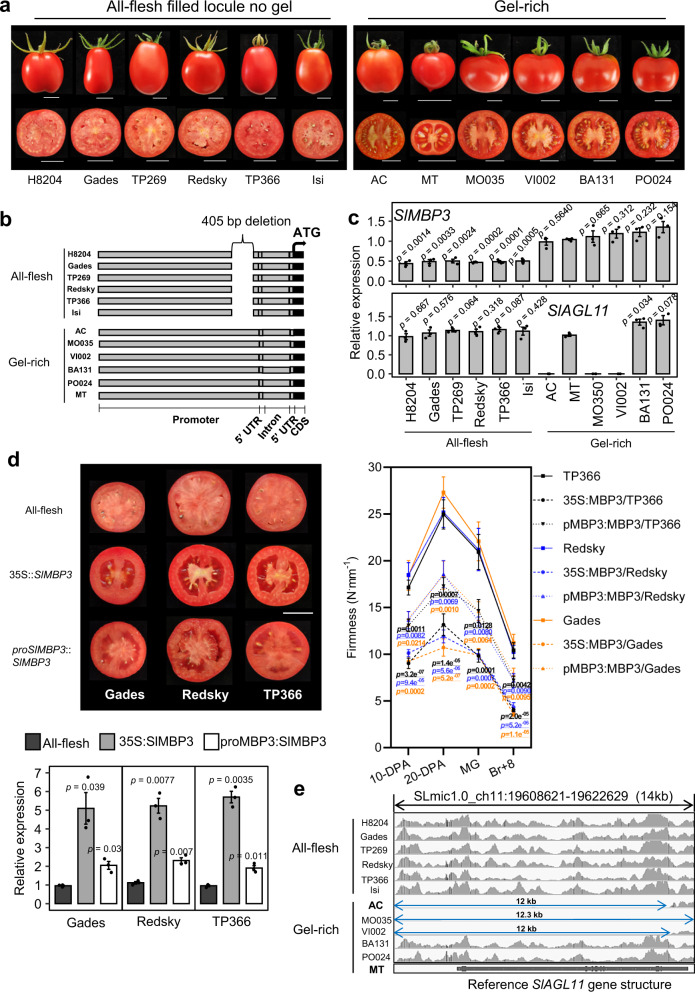
Fig. 1. Locular tissue development and SlMBP3 expression levels in various tomato accessions.
a Tomato fruits of cultivars representative of two types of locular tissues defined as All-flesh with no gel and Gel-rich with locules filled with liquefied gel at BR + 8 stage. BR, breaker. b Map of structural variants in twelve cultivars. The DNA segment (2.7 kb) upstream of the SlMBP3 CDS is represented. c SlMBP3 and SlAGL11 transcript levels were calculated based on the transcript levels of the actin internal reference gene in each line and the outcome of the qPCR data for each line was compared to those of MT to assess change significance using t-test in twelve tomato cultivars at 20-DPA fruit stage. DPA, days post-anthesis. Values are means ± standard deviation (SD) of three biological replicates. Significance was determined by two-tailed Student’s t-test. d The left panel shows fruit sections of the All-flesh lines Gades, Redsky and TP366 and their versions expressing either 35S::SlMBP3 or proSlMBP3::SlMBP3. The right panel shows the assessment of fruit firmness in All-flesh lines and their versions expressing 35S::SlMBP3 or proSlMBP3::SlMBP3 at different fruit development stages. Values are means ± SD of n = 10 fruits, for each individual line 10 fruits per stage were used and significance was determined by two-tailed Student’s t-test. All-flesh lines are taken as reference. MG, mature green; BR, breaker. The lower panel shows the SlMBP3 transcript levels in All-flesh lines and their versions expressing 35 S::SlMBP3 or proSlMBP3::SlMBP3 at 20-DPA fruit stage. Values are means ± standard deviation (SD) of three biological replicates. Significance was determined by two-tailed Student’s t-test. e Genomic sequences of SlAGL11 locus in twelve tomato accessions visualized with Integrative Genomics Viewer showing the deletion (blue arrows) of the complete SlAGL11 gene in Ailsa Craig (AC), MO035 and VI002 tomato accessions. MicroTom (MT) was used as reference line. Scale bars in (a and d) represent 2 cm. Source data are provided as a Source Data file.

