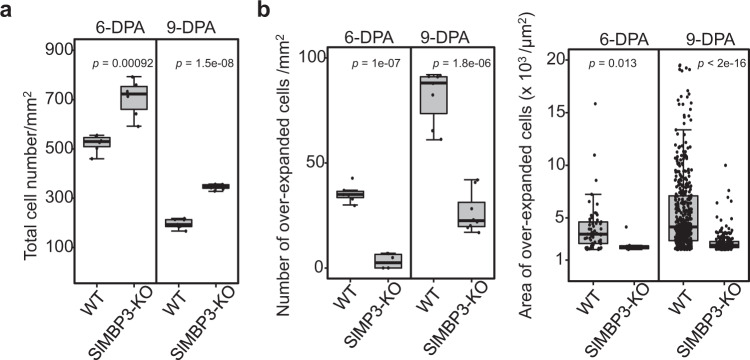
Fig. 8. Assessing the number and area of cell types in the locular tissue of WT and SlMBP3-KO fruit.
a Quantification of the mean total number of cells including over-expanded fused cells per mm2 of locular tissue at 6-DPA and 9-DPA. (n = 16–21 ROIs contained in 6–8 fruits per stage coming from six individual plants for each genotype and in the case of SlMBP3-KO corresponding to two independent lines). Values are means ± SD, and significance was determined by two-tailed Student’s t-test. b Quantification of the mean number of over-expanded and disintegrated cells per mm2 of locular tissue at 6-DPA and 9-DPA (left panel) (n = 18–21 ROIs contained in eight fruits per stage and per genotype). The right panel shows the measurement of the area of these individual cells at 6-DPA and 9-DPA (n > 30 cells per stage and per genotype). Values are means ± SD, and significance was determined by two-tailed Student’s t-test. Box edges represent the 0.25 and 0.75 quantiles, and the bold lines indicate median values. Whiskers indicate 1.5 times the interquartile range. Note that no measurement was performed at 3-DPA corresponding to the onset of a few locular gel cells in both genotypes. Source data are provided as a Source Data file.

