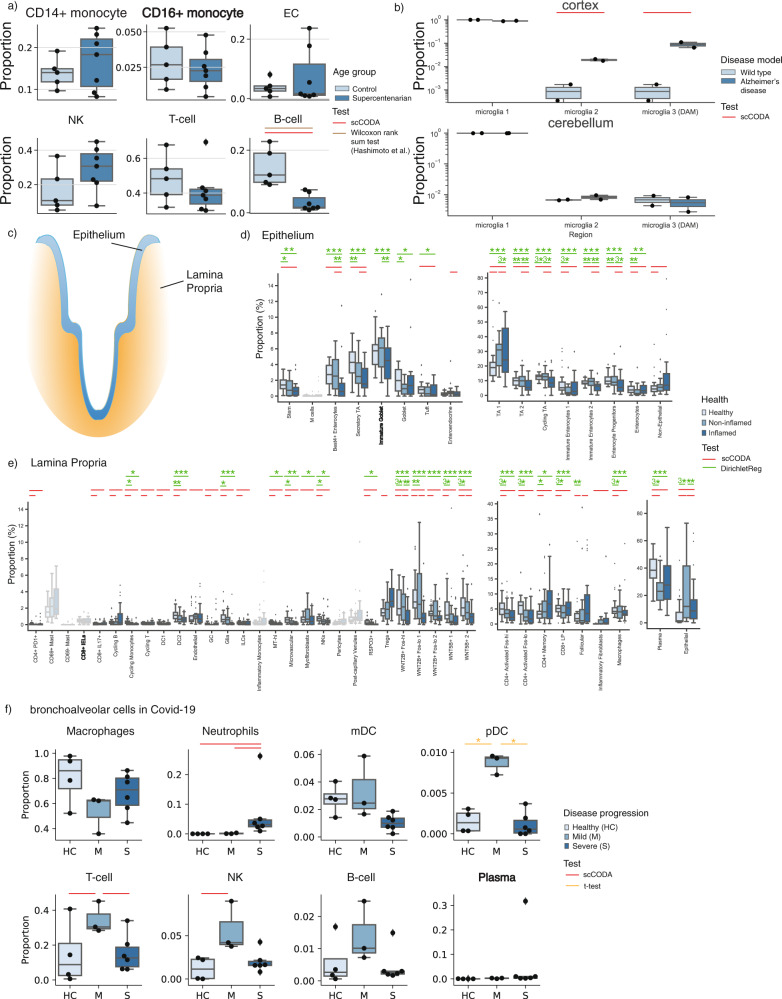
Fig. 3. scCODA determines the compositional changes in a variety of examples.
References are indicated in bold. a Boxplots of blood samples of supercentenarians (n = 7, dark blue) have significantly fewer B cells than younger individuals (control, n = 5, light blue), reference was set to CD16+ Monocytes, Hamiltonian Monte Carlo (HMC) chain length was set to 20,000 with a burn-in of 5000. Credible and significant results are depicted as colored bars (red: scCODA, brown: Wilcoxon rank-sum test (two-sided; Benjamini–Hochberg corrected)3). Results are in accordance with FACS data3. P values and effect sizes are shown in Supplementary Data 1. b Microglia associated with Alzheimer’s disease (AD) are significantly more abundant in the cortex, but not in the cerebellum19 (n = 2 in AD (dark blue) and wild-type (light blue) mice, respectively), HMC chain length was set to 20,000 with burn-in of 5000. P values and effect sizes are shown in Supplementary Data 2. c–e Changes in epithelium and lamina propria in the human colon1 in ulcerative colitis (UC) (n = 133 from 18 UC patients, 12 healthy donors). Credible and significant results are depicted as colored bars (red: scCODA, green: two-sided t test of Dirichlet regression coefficients). Stars indicate the significance level (*adjusted P < 0.05, **adjusted P < 0.01, ****adjusted P < 0.001; Benjamini–Hochberg corrected). c Epithelium and Lamina propria are distinct tissues, which are studied separately. d Compositional changes from healthy (light blue) to non-inflamed (medium blue) and inflamed (dark blue) biopsies of the intestinal epithelium, HMC chain length was set to 150,000 with burn-in of 10,000. P values and effect sizes are shown in Supplementary Data 3. e Boxplots of compositional changes from healthy (light blue) to non-inflamed (medium blue) and inflamed (dark blue) biopsies in the lamina propria, HMC chain length was set to 400,000 with burn-in of 10,000. P values and effect sizes are shown in Supplementary Data 3. f Boxplots of compositional changes in bronchoalveolar cells in COVID-19 patients (n = 4 healthy (light blue), n = 3 mild (medium blue), n = 6 severe (dark blue) disease progression)4. Credible and significant results are depicted as colored bars (red: scCODA, orange: t test (two-sided; Benjamini–Hochberg corrected)), references for scCODA: Plasma (all pairwise comparisons between conditions), FDR at 0.2. Stars indicate the significance level (*: adjusted P < 0.05, **adjusted P < 0.01, ***adjusted P < 0.001; Benjamini–Hochberg corrected), HMC chain length was set to 80,000 with a burn-in of 10,000. P values and effect sizes are shown in Supplementary Data 4. a, b, d–f In all boxplots, the central line denotes the median, boxes represent the interquartile range (IQR), and whiskers show the distribution except for outliers. Outliers are all points outside 1.5 times of the IQR.

