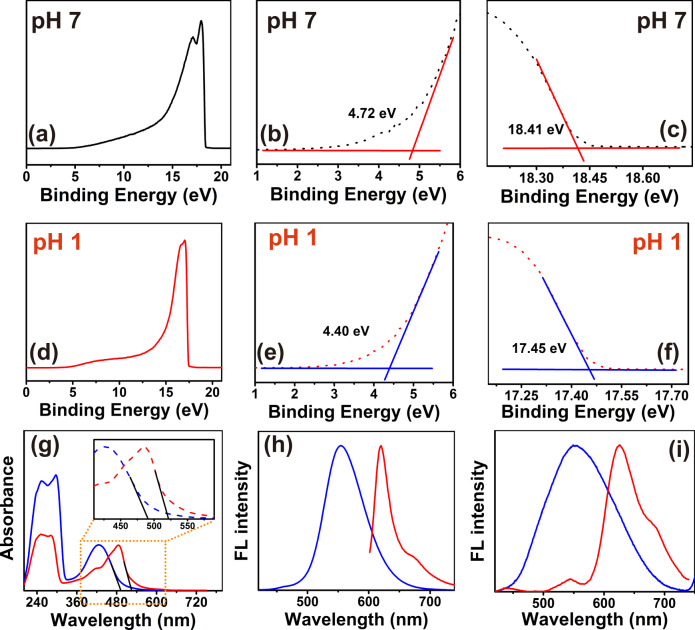
Fig. 7. Energy level structure variation of the CDs by the protonation treatment.
a−c full-scale ultraviolet photoelectron spectroscopy (UPS), near Fermi energy (low binding energy) and secondary electron cut-off (high binding energy) regions of CDs before the protonation; d−f UPS, near Fermi energy and secondary electron cut-off regions of CDs after the protonation. g UV−Vis spectra, h one-photon fluorescence spectra; i two-photon fluorescence spectra of CDs before and after the protonation. (P-CDs: CDs after the protonation treatment).

