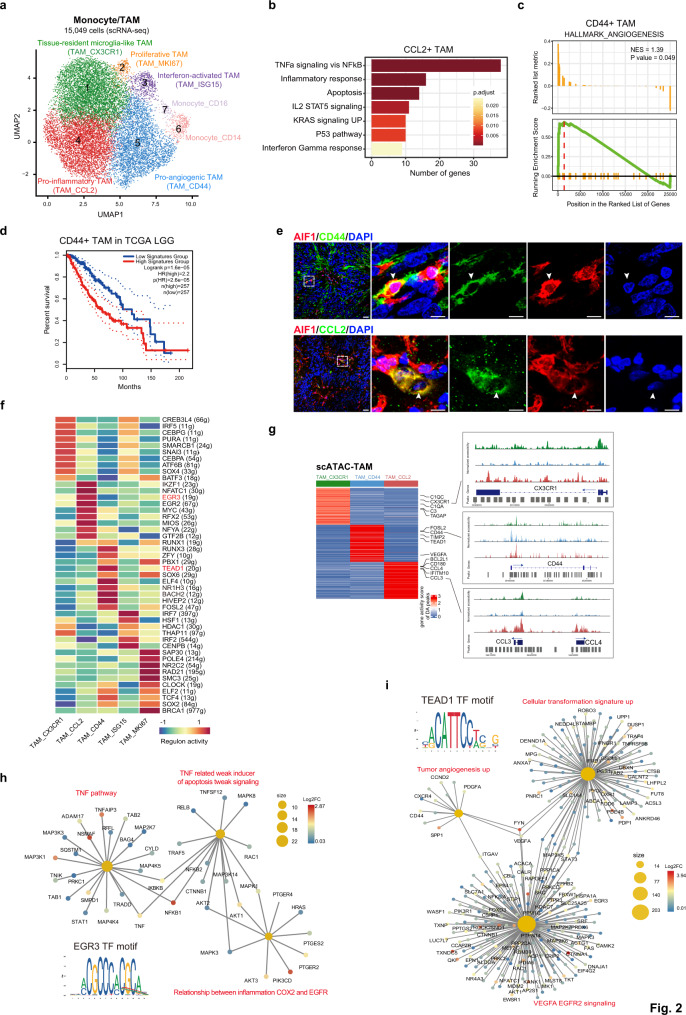
Fig. 2. Two TAM subsets show distinct functional phenotypes in ependymomas.
a UMAP plot of seven subclusters of monocytes and TAMs. b Bar plot of enriched hallmark pathways for genes upregulated in CCL2+ TAMs. P values were calculated by using enrichr function from R package clusterProfiler with hypergeometric test statistical analyses. Source data are provided as a Source Data file. c Enrichment plot of the hallmark angiogenesis pathway in CD44+ TAMs. P values were calculated by using GESA function from R package clusterProfiler. d Kaplan–Meier plot showing worse clinical outcome for high expression of CD44+ TAMs signature genes in LGG patients from TCGA. +, censored observations. P values were calculated by using both the log-rank test and Cox proportional hazards model. e Representative example of an EPN tumor stained by IF. The upper panel image indicates AIF1+CD44+ TAMs (the scale bar represents 30 μm). The dashed boxes highlight regions shown on the right side and the arrow depicts the CD44+ TAMs in fluorescent images (the scale bar represents 100 μm). The bottom panel image indicates AIF1+CCL2+ TAMs (the scale bar represents 30 μm). The dashed boxes highlight regions shown on the right side and the arrow depicts the CCL2+ TAMs in fluorescent images (the scale bar represents 100 μm). Images shown are representatives of three samples from three independent experiments. f Heatmap showing TF activity for each TAM subsets. The row name showed the regulon gene sets name and gene number is written in the round brackets. The red color marks the regulon of interest. g Heatmap showing cluster-specific ATAC-seq peaks (left). Browser tracks showing ATAC-seq signals for selected marker genes (right). h Network plot of enriched curated gene sets for genes regulated by EGR3 in CCL2+ TAM subset. Nodes for genes were colored by log2FC, and the sizes of nodes for enriched pathways were correlated with the number of genes. i Network plot of enriched curated gene sets for genes regulated by TEAD1 in CD44+ TAM subset. Nodes for genes were colored by log2FC, and the sizes of nodes for enriched pathways were correlated with the number of genes. See also Supplementary Figs. 2–3 and Supplementary Data 3–5.

