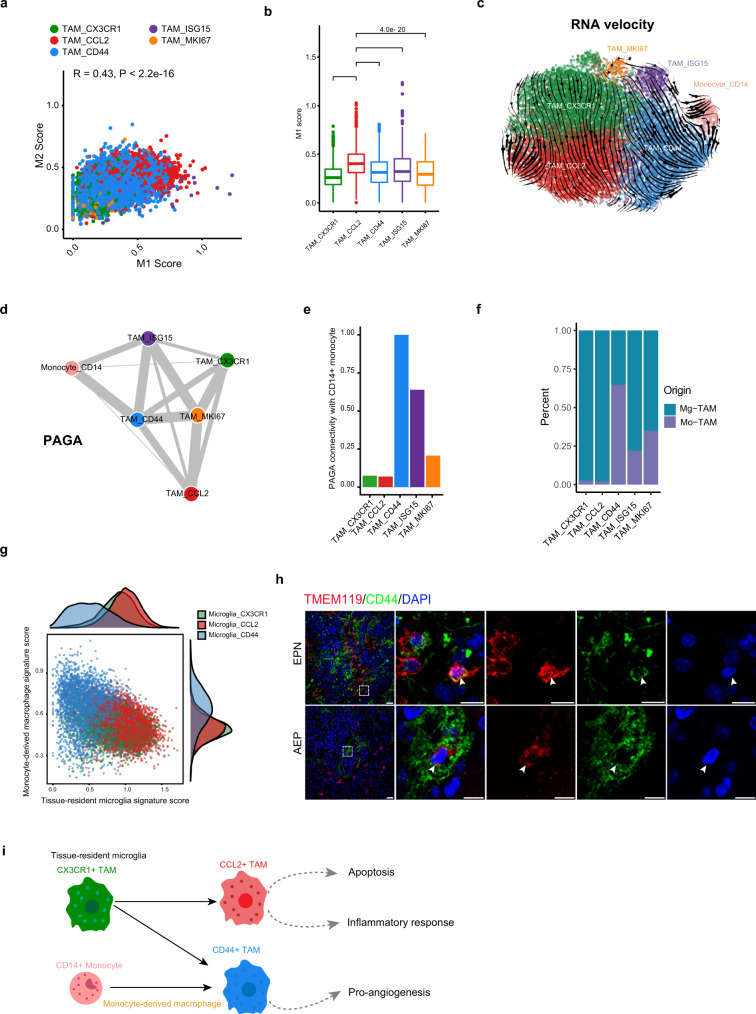
Fig. 3. Developmental trajectory of TAM subsets in spinal ependymomas.
a Scatter plot showing the Pearson correlation between the M1 and M2 signature scores. b Box plot showing the M1 signature score in each TAM subset. P values were calculated by the Wilcoxon test, two-sided comparisons. Multiple hypothesis correction using the Benjamini–Hochberg procedure. n = 15,049 cells. The center line, bounds of box, and whiskers represent mean, 25th to 75th percentile range, and minimum to maximum range in all boxplots. c Steady-state RNA velocity of TAM subsets. d PAGA graph showing the inferred developmental trajectories for TAM subsets. The edge width was correlated with the strength of connectivity between two subclusters. e Bar plot showing PAGA connectivity with CD14+ monocytes. f Bar plot showing the proportion of monocyte origin and tissue-resident microglia origin across each TAM subset (using data reported by Pombo et al. as a reference). Source data are provided as a Source Data file. g Scatter plot showing the scores by average expression of signature genes of tissue-resident microglia versus monocyte-derived macrophages. h Representative examples of tumor section stained by IF. The upper panel image indicates CD44+ TMEM119+ microglia in EPN tumor (the scale bar represents 30 μm). The dashed boxes highlight regions shown on the right side and the arrow depicts the CD44+ microglia in fluorescent images (the scale bar represents 100 μm). The bottom panel image indicates CD44+ TMEM119+ microglia in AEP tumor (the scale bar represents 30 μm). The dashed boxes highlight regions shown on the right side and the arrow depicts the CD44+ microglia in fluorescent images (the scale bar represents 100 μm). Images shown are representatives of three samples from three independent experiments. i Model of the developmental trajectory of monocyte/TAM lineages in spinal ependymomas. See also Supplementary Figs. 3 and 4.

