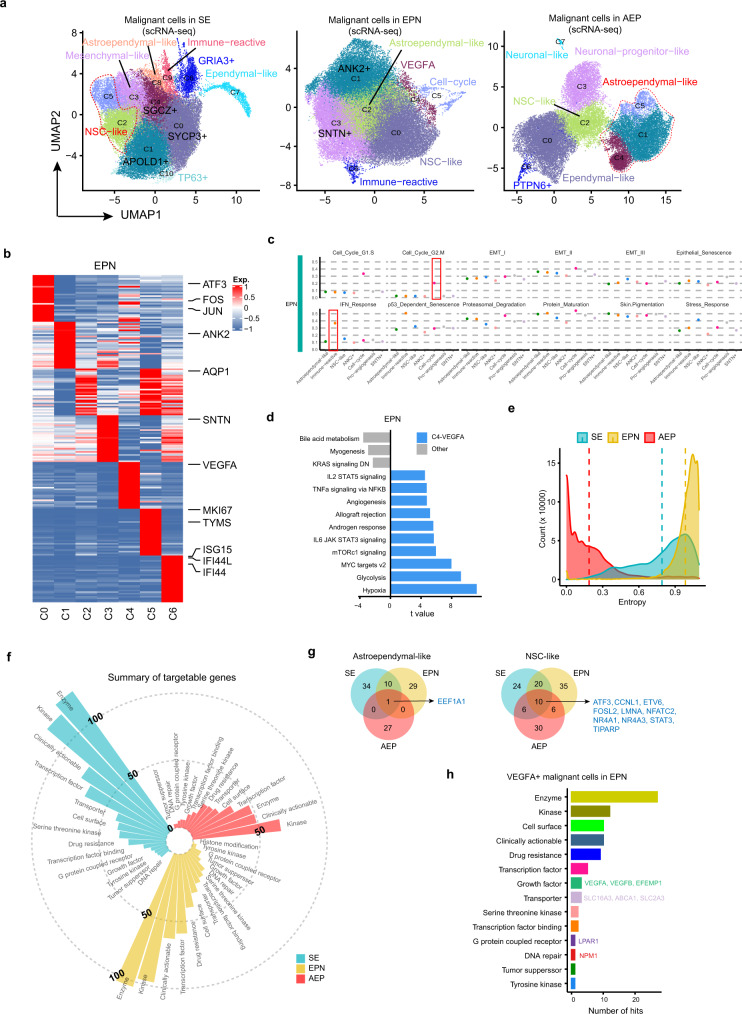
Fig. 4. Heterogeneity of malignant cells in each ependymoma cancer subtype.
a UMAP plots showing subclusters of malignant cells in each cancer subtype, donor effect corrected by Harmony. b Heatmap showing signature genes for each malignant cell subcluster in EPN. Selected genes were labeled on the right side. c Scatter plots showing average expression of 12 generic tumor cell programs in each malignant subset in EPN. The boxes highlight programs which were expressed in specific subsets. d Bar plot showing different pathways enriched in VEGFA+ C4 and other clusters from EPN scored per cell by gene set variation analysis (GSVA). t values were calculated with limma regression. e Density plot showing the entropy of patient distribution for malignant cells in each cancer subtype. f Circular bar plot showing the number of targetable genes from different categories in each cancer subtype. g Venn plots showing the intersection of targetable genes in astroependymal-like and NSC-like subpopulations across different cancer subtypes. The shared genes between the three cancer subtypes are listed on the right side. h Bar plot showing the number of targetable genes from different categories in VEGFA+ subpopulation of EPN. Source data are provided as a Source Data file. See also Supplementary Fig. 5 and Supplementary Data 6 and 7.

