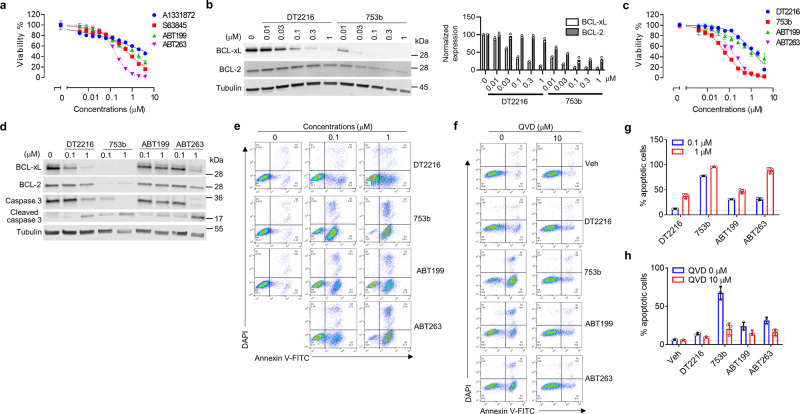
Fig. 7. 753b is a more potent anti-leukemic agent than DT2216.
a Kasumi-1 AML cells are primarily dependent on BCL-xL/2 for survival. Viability of Kasumi-1 AML cells was measured after the cells were incubated with serially diluted ABT199 (a selective BCL-2 inhibitor), ABT263 (a dual BCL-xL/BCL-2 inhibitor), A1331872 (a selective BCL-xL inhibitor), or S63845 (a selective MCL-1 inhibitor), for 72 h. IC50 values for ABT199, ABT263, A1331872, and S63845 are 866.9, 156.5, 3587.0, and 527.4 nM, respectively. b Potencies of 753b and DT2216 in degrading BCL-xL/2 by immunoblots in Kasumi-1 cells after 16 h treatment. Tubulin was used as an equal loading control. The normalized protein content in the immunoblots is presented as mean values (n = 2 biologically independent experiments) in the bar graph (right panel). c–h 753b is more potent against Kasumi-1 cells than DT2216. c Viability of Kasumi-1 cells was measured after the cells were incubated with serially diluted DT2216, 753b, ABT199, or ABT263 for 72 h. IC50 values for DT2216, 753b, ABT199, and ABT263 are 1147.0, 59.64, 1130.0, and 130.9 nM, respectively. For the viability assays, the data are presented as mean ± s.d. from three replicate cell cultures in a representative experiment. Similar results were also observed in two additional independent experiments. d Representative immunoblot analyses of Kasumi-1 cells 16 h after treatment as indicated. Tubulin was used as an equal loading control. e Representative flow cytometry analyses of apoptosis using Annexin-V and DAPI staining in Kasumi-1 cells 24 h after treatment as indicated. f Representative flow cytometry analyses of apoptosis using Annexin-V and DAPI staining in Kasumi-1 cells after incubated with or without the pan-caspase inhibitor QVD (10 μM) for 2 h prior to being treated with DMSO (Veh) or 0.1 μM DT2216, 753b, ABT199, or ABT263 for 24 h. g, h Percentages of apoptotic cells in Kasium-1 cells analyzed by flow cytometry as shown in (e, f) are presented as mean ± s.d. from three replicate cell cultures in a representative experiment. Data are representative of two independent experiments. The dotted line represents the value from DMSO-treated cells. Source data are provided as a Source data file.

