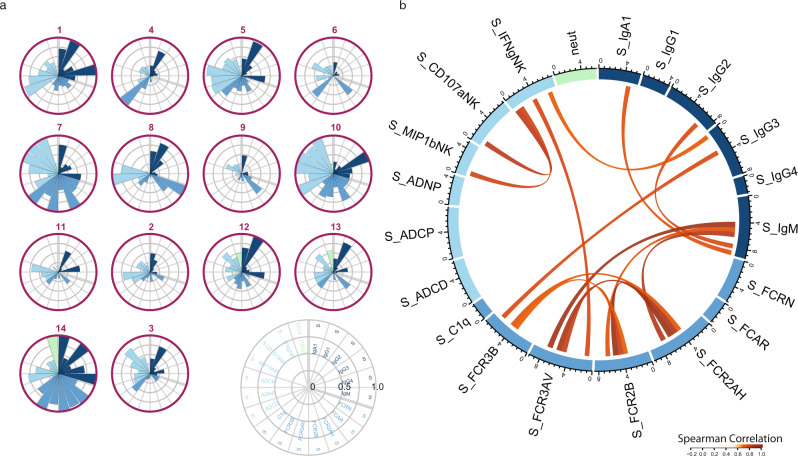
Fig. 1. Heterogeneity of anti-spike antibody profiles in convalescent plasma was not captured by neutralizing antibody titer.
CP units were profiled for SARS-CoV-2S-specific antibody responses. a Each polar plot depicts an individual donor’s anti-Spike antibody profile, scaled to the minimum and maximum of the 14 CP units profiled. Each wedge represents a SARS-CoV-2 antibody feature, and the size of the wedge indicates the magnitude of the value. The colors represent the feature group: dark blue—antibody isotypes and subclasses; blue—Fc-receptor binding levels; light blue—antibody-dependent functions; light green—neutralizing antibody titer. b Cord diagram representing the statistically significant correlation among S-specific antibody features in CP units with Spearman correlation > 0.5 and two-sided p-value < 0.05. The width of antibody each feature represents the accumulated values of Spearman correlation coefficients of that feature with all other features included in the diagram. The color of the cord represents the strength of Spearman correlation, with a higher correlation having darker red values. Source data are provided as a Source Data file.

