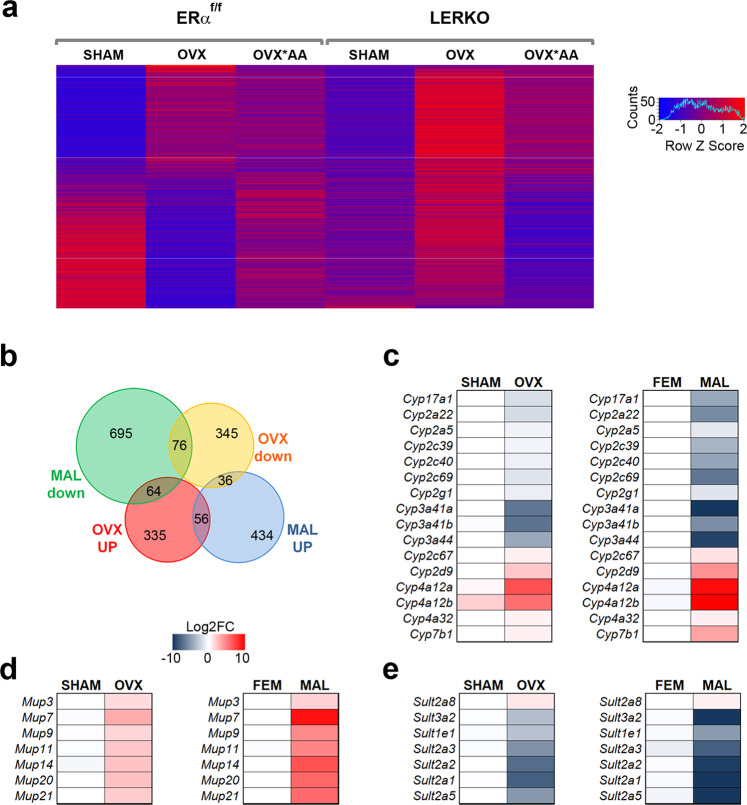
Fig. 5. Comparison of hepatic transcriptomes from different female genotypes and from males.
a Heatmap showing overall the DEGs from RNA-Seq analysis (n = 4) related to OVX and/or diet in ERαf/f and LERKO females. b Venn diagram summarizing the overlap between DEGs identified by RNA-Seq (n = 4) in the liver of male, fertile female and OVX female ERαf/f mice. c–e Heatmaps reporting as Log2FC the mean expression (n = 4) of the most enriched class of genes differentially expressed in the livers of OVX ERαf/f females and in the livers of ERαf/f males with respect to fertile ERαf/f females. Source data are provided in56; processed data are provided as a Source Data file.

