
Figure 4.
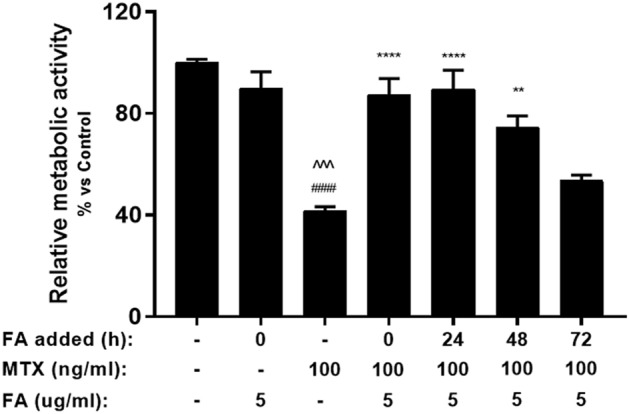
Relative metabolic activity of MTX and FA-treated organoids at different stages of treatment. MTX-treated organoids were supplemented with FA at different time points (0, 24, 48 and 72 h) with 5 µg/mL FA (n = 4). Metabolic activity was measured by WST-1 assay. All data are presented as Mean ± SEM. ####p < 0.0001 represents the significant differences observed between untreated organoids and MTX-treated organoids. ^^^p < 0.001 represents the significant differences between FA-treated organoids and MTX-treated organoids. **p < 0.01 and ****p < 0.0001 represent the differences observed between MTX-treated organoids and MTX/FA-treated organoids.