Figure 5.
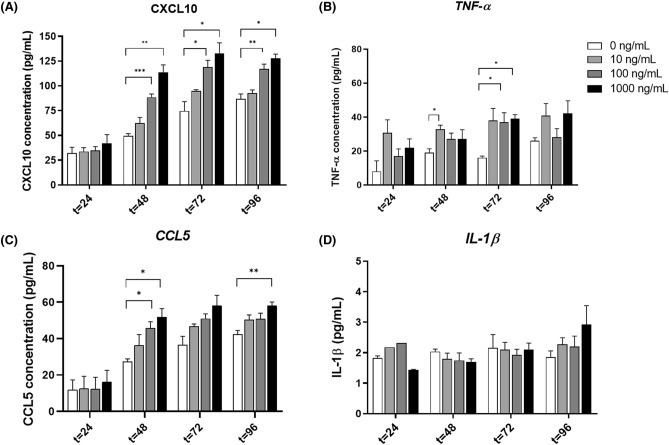
Cytokine and chemokine production in the MTX-induced mucositis organoids. Organoids were treated with 10, 100 and 1000 ng/mL MTX and incubated for 96 h. At different time points supernatant was collected and CXCL10 (A), CCL5 (B), TNF-α (C) and IL-1β (D) measured by Multiplex Immunoassay (n = 4). All data are presented as mean ± SEM. * (p < 0.05), ** (p < 0.01) and *** (p < 0.001) represent the significant changes between the MTX-treated and untreated groups.

