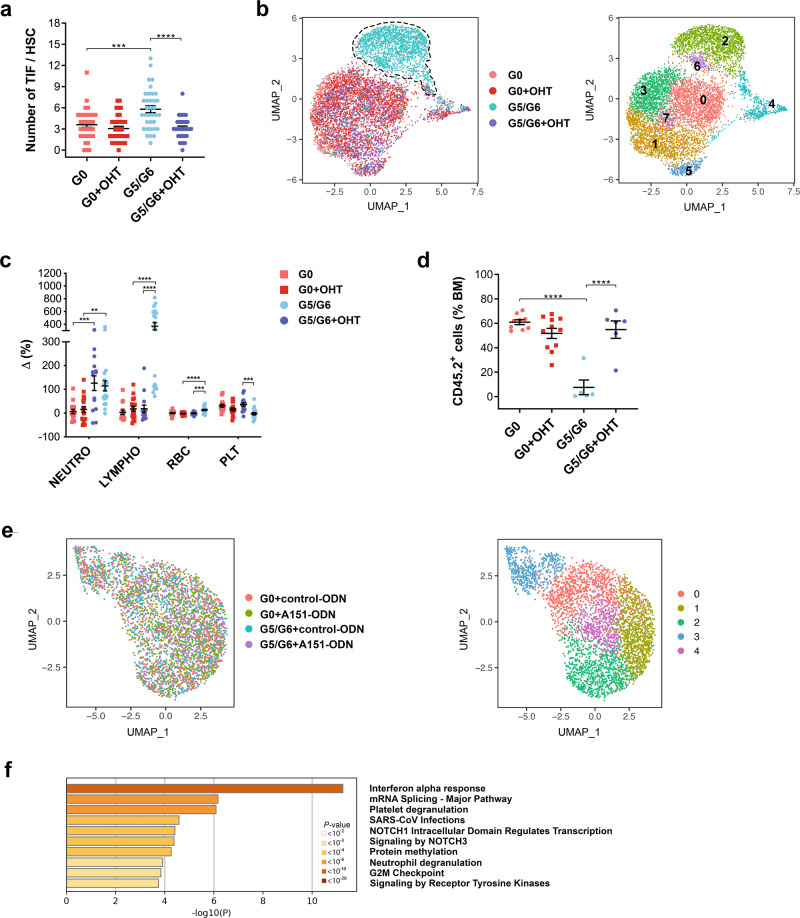
Fig. 4. IFN signaling activation and HSC decline are the results of telomere damage and not responses to viral infection.
a Numbers of telomere dysfunction–induced foci (TIF) per HSC. Bars represent the means ± S.E.M. of TIF per HSC (n = 35 pooled HSCs from 4 G0, 2 G5/G6, 6 G0 + OHT, and 4 G5/G6 + OHT-treated mice); each dot represents one HSC. Statistically significant differences were detected using one-way ANOVA. ***P < 0.001, ****P < 0.0001; G0 vs G0 + OHT: P = 0.72. b UMAP of scRNA-seq data displaying 1638, 1926, 1533, and 1777 pooled single HSCs isolated from R26-LSL G0 mice treated with vehicle (G0) or OHT (G0 + OHT) and from R26-LSL G5/G6 mice treated with vehicle (G5/G6) or OHT (G5/G6 + OHT), respectively (n ≥ 5 mice per group from two independent experiments of telomerase reactivation). Each dot represents one cell. Different colors represent the sample (left; dashed lines indicate the majority of G5/G6 HSCs) and cluster (right) identities. c Differences in the blood cell counts of each mouse between the start and end of treatment. Each dot represents one mouse (n = 15 G0, 14 G5/G6, 18 G0 + OHT, and 19 G5/G6 + OHT-treated mice from four independent experiments of telomerase reactivation). Data were expressed as percentages of delta variation ([cell blood count after treatment–cell blood count before treatment]/cell blood count before treatment). Bars represent the means ± SEM. Statistically significant differences were detected using one-way ANOVA. **P < 0.01, ***P < 0.001, ****P < 0.0001. Neutro neutrophils, Lympho lymphocytes, RBC red blood cells, PLT platelets. d Frequencies of CD45.2+ cells in the BM of CD45.1 recipients that were competitively transplanted with equal numbers of HSCs (n = 200) isolated from R26-LSL mice with the indicated genotypes and treatments (n = 9 G0, 5 G5/G6, 11 G0 + OHT, and 6 G5/G6 + OHT-treated mice from two independent experiments of telomerase reactivation). Bars represent the means ± SEM. Statistically significant differences were detected using one-way ANOVA. ****P < 0.0001; G0 vs G0 + OHT: P = 0.40. e UMAP of scRNA-seq data of pooled single HSCs isolated from G0 mice treated with a control oligonucleotide (G0 + control-ODN; 1021 HSCs) or the oligodeoxynucleotide A151 (G0 + A151-ODN; 1129 HSCs) and from G5/G6 mice treated with a control oligodeoxynucleotide (G5/G6 + control-ODN; 929 HSCs) or the oligodeoxynucleotide A151 (G5/G6 + A151-ODN; 955 HSCs) (n ≥3 mice per group). Each dot represents one cell. Different colors represent the sample (left) and cluster (right) identities. f Pathway enrichment analysis of significantly downregulated genes in A151-ODN–treated G5/G6 HSCs from cluster 2 shown in Fig. 4e, as compared to those in control-ODN–treated G5/G6 HSCs (adjusted P ≤ 0.05). The top ten Hallmark and Reactome gene sets are shown. Source data are provided as a Source Data file.

